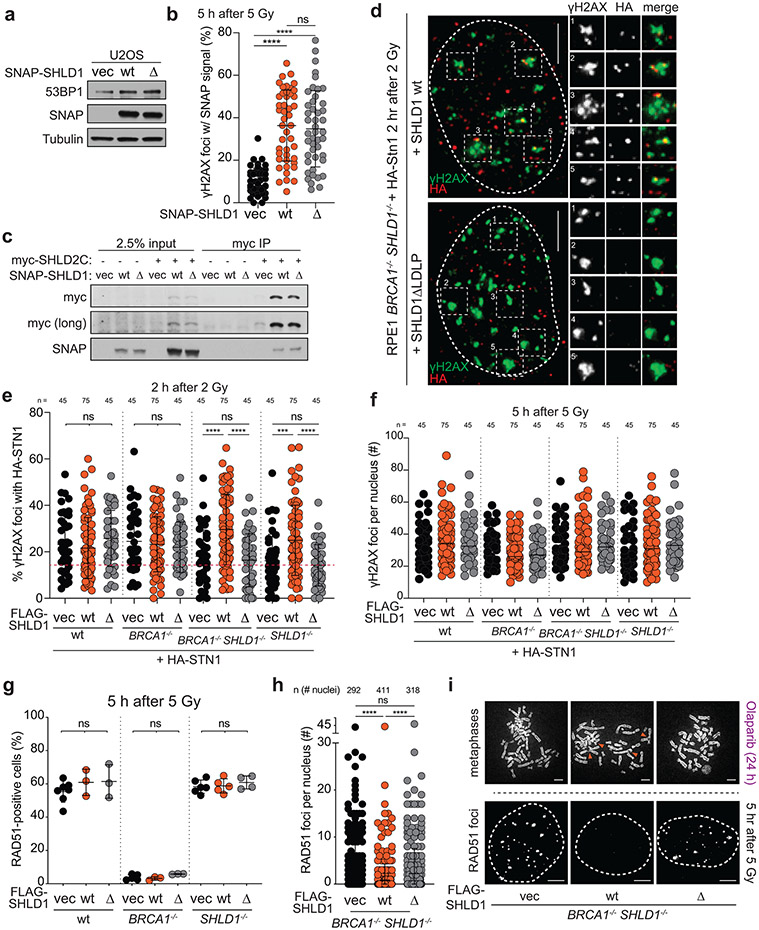
Extended Data Fig. 8. Characterization of SHLD1Δ. Related to Fig. 5.
a, Immunoblots showing expression of SNAP-SHLD1 or SNAP-SHLD1ΔLDLP (Δ) in U2OS cells. b, Quantification of SNAP-SHLD1 localization to IR-induced γH2AX foci in cells as in a. n = 45 nuclei pooled from three independent experiments. c, Immunoprecipitation of myc-SHLD2C (aa 421-904) and immunoblot for SNAP-SHLD1 co-expressed in 293T cells. d, Representative IF images showing γH2AX co-localizing with HA-STN1 in irrradiated BRCA1/SHLD1 DKO cells complemented with wt SHLD1 or SHLD1Δ. Nuclear outlines are demarcated by dashed white lines. Scale bars, 5 μm. Five sample foci are shown for each nucleus. e, Quantification of IR-induced γH2AX foci with HA-STN1 signal in the indicated cells. Red dotted line: the average background level across multiple conditions of random overlaps between γH2AX and HA foci (see Materials and Methods). f, Quantification of γH2AX foci in the indicated RPE1 cells with HA-STN1 as in d and e. Center bar indicates median. g, Quantification of RAD51 foci as in Fig. 5e in parental (wt), BRCA1 KO, or SHLD1 KO RPE1 cells. n = 3-7 independent experiments (as indicated by the number of data points). Ordinary one-way ANOVA was performed with Tukey’s correction for multiple comparisons in g. h, Quantification of the number of RAD51 foci per nucleus for cells as in Fig. 5e with the indicated FLAG-SHLD1 constructs. In e, f, and h, the number of nuclei (n, each represented by a dot) pooled from three independent experiments is indicated. i, Representative images of DAPI-stained metaphase spreads (top; orange arrows denote aberrant radial chromosomes) or RAD51 foci (bottom; nuclear outlines demarcated by dashed white lines) in BRCA1/SHLD1 DKO cells complemented with an empty vector control, wt SHLD1, or SHLD1Δ. Scale bars, 5 μm. a and c are representative of two independent experiments.. Statistical analyses as in Fig. 1. All means are indicated with center bars (unless otherwise noted) and SDs with error bars.

