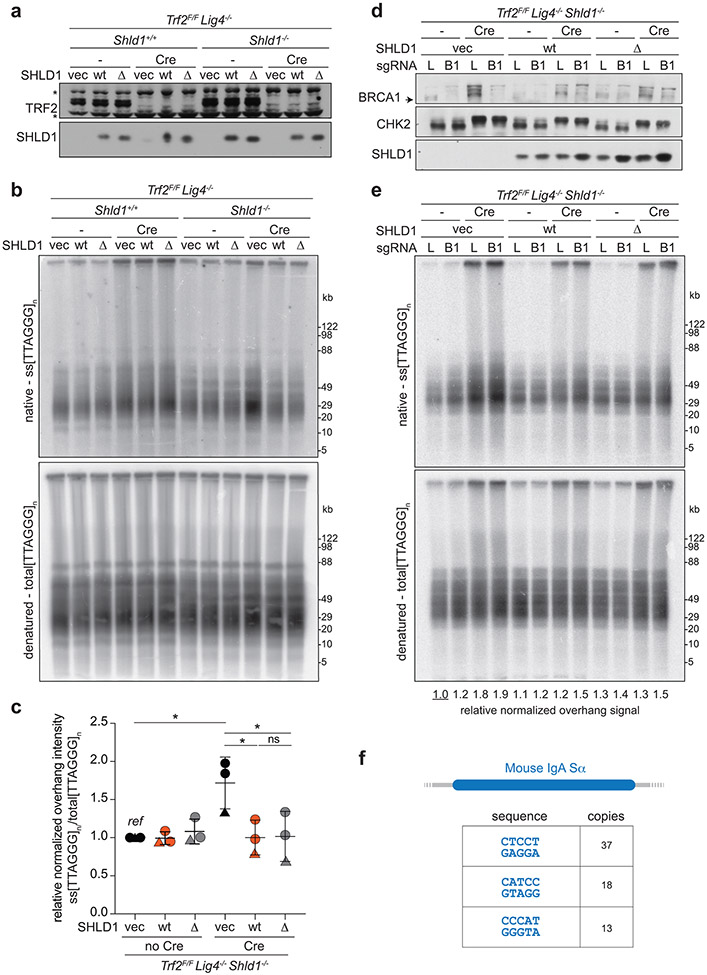
Extended Data Fig. 10. SHLD1Δ suppresses overhang length at TRF2-deficient telomeres. Related to Fig. 6.
a, Immunoblot showing SHLD1 construct expression and TRF2 deletion by Cre in Trf2F/F Lig4−/− Shld1+/+ or Shld1−/− clones. Asterisks indicate non-specific bands. b, Quantitative analysis of telomeric ss overhang intensity in cells as in a. c, Quantification of overhangs from Trf2F/F Lig4−/− Shld1−/− cells (n = 3 independent experiments. a-c represent data from three independent experiments using two independent clones (circles and triangle). d, Immunoblot showing bulk CRISPR KO of BRCA1 (arrow), phosphorylation of CHK2 after TRF2 deletion, and SHLD1 construct expression. e, Telomeric overhang analysis on cells as in d. Statistical analysis was performed using two-tailed ratio-paired t-test. *, p<0.05; **, p<0.01; ns, not significant. Experiments in d, e have been performed once. f, Schematic of mouse IgA Switch region with several five nucleotide repeat sequences and their number of repeats in the region (4.4 kb). All means are indicated with center bars and SDs with error bars.

