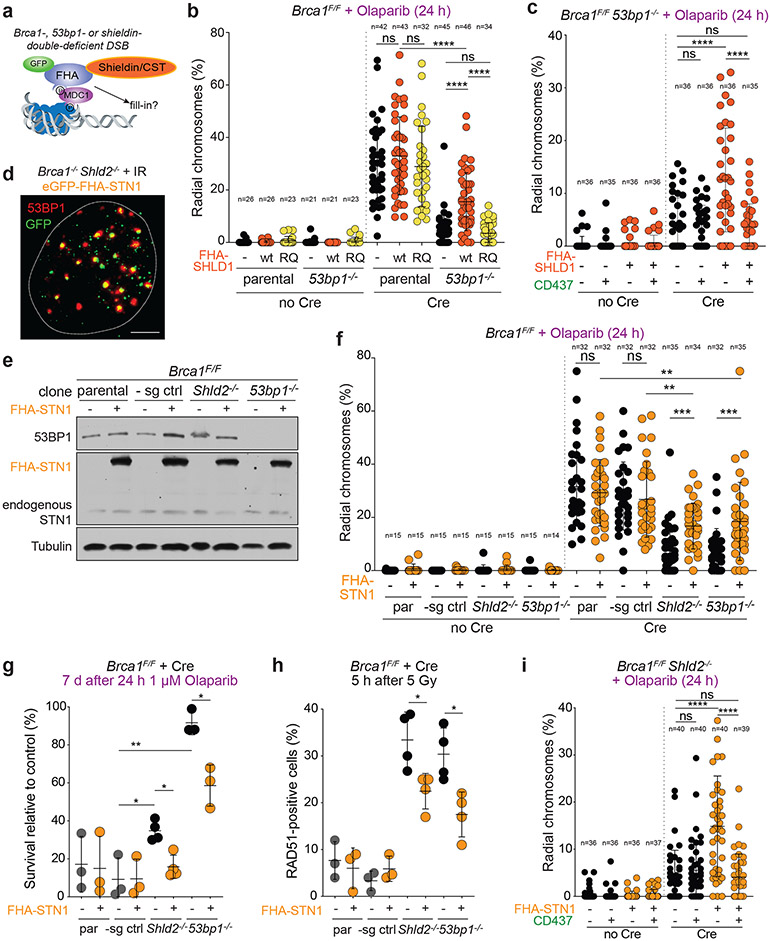
Fig. 4. Bypass of 53BP1/shieldin by artificial tethering of CST.
a, Schematic of 53BP1/shieldin-independent recruitment of FHA-fusions to phosphorylated MDC1 at DSBs. b, Quantification of the percent of chromosomes involved in radial structures in the indicated cell lines with wt FHA-SHLD1 or FHA-SHLD1 with an FHA domain mutation (R61Q) which prohibits recruitment to DSBs. c, Quantification as in b in Brca1F/F 53bp1−/− cells with or without FHA-SHLD1 and Polα inhibitor. d, Representative image of irradiated Brca1−/− Shld2−/− cells harboring eGFP-FHA-STN1, which colocalizes with 53BP1 IR-induced foci. The nucleus is demarcated by the dashed white line. Representative of three independent experiments. Scale bar, 5 μm. e, Immunoblots for BRCA1, 53BP1, and (FHA-)STN1 in the indicated MEFs. Representative of two independent experiments. f, Quantification as in b in the indicated cell lines with or without FHA-STN1. g, Quantification of colony formation by MEFs of the indicated genotype with or without FHA-STN1 and treated with 1 μM Olaparib for 24 h. Survival after PARPi was compared to undrugged cells. Each dot represents one of three or four independent experiments. h, Quantification of the percent of RAD51-positive cells in irradiated MEFs of the indicated genotype with or without FHA-STN1. Each dot represents one of three or four independent experiments. i, Quantification of radial chromosome formation as in c in Brca1F/F Shld2−/− cells with or without FHA-STN1 and Polα inhibitor. In b ,c, f, and i, the number of metaphases (n, each represented by a dot) pooled from three independent experiments is indicated in the figure. Statistical analyses as in Fig. 1. All means are indicated with center bars and SDs with error bars.

