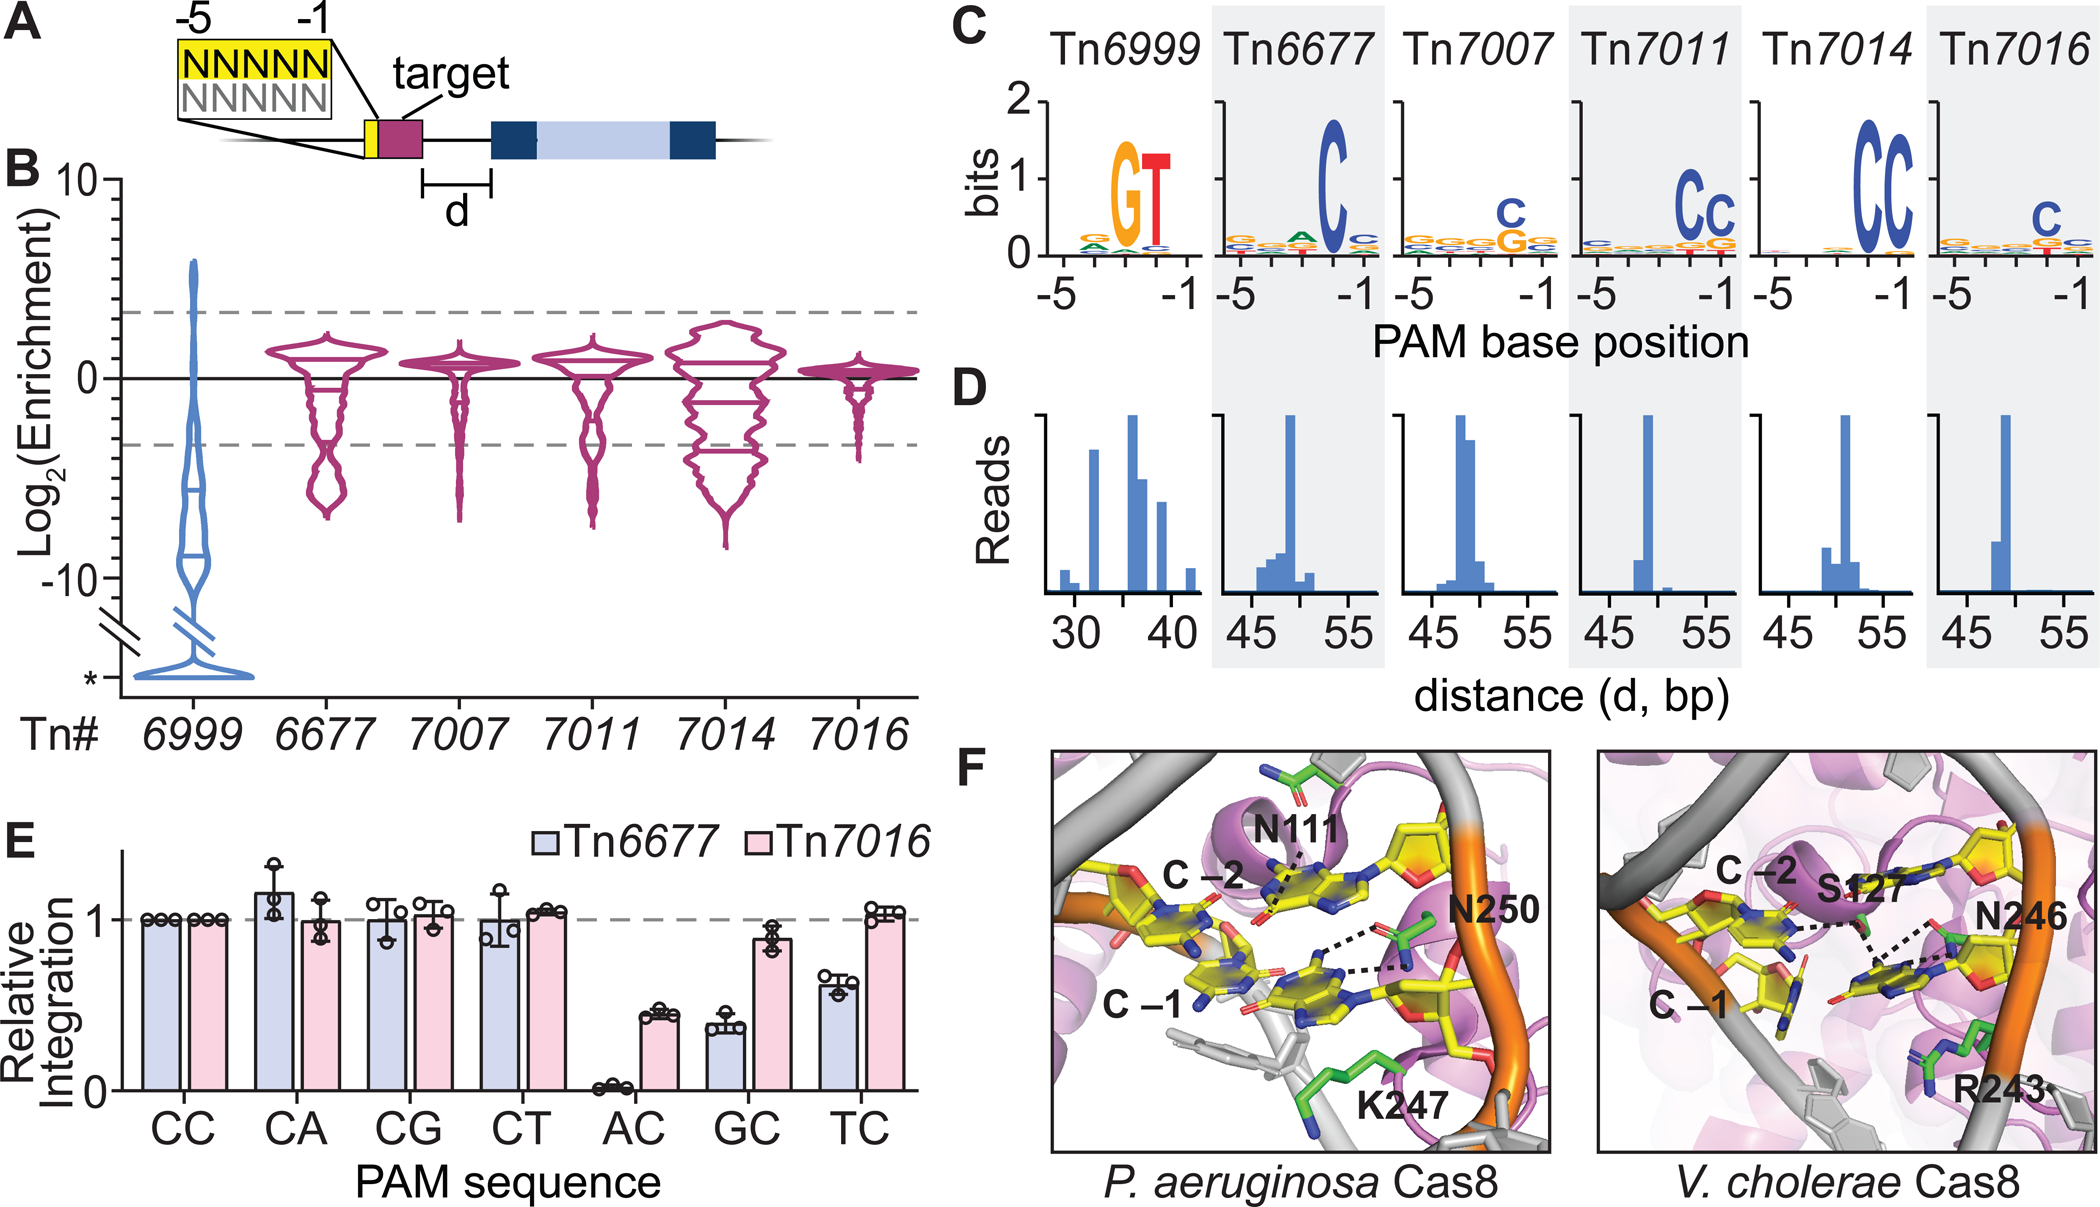
Figure 2. PAM requirements and integration site variation for CRISPR-Tn homologs.

(A) Schematic representation of a PAM library transposition assay, in which a pTarget plasmid encodes a 32-bp target sequence flanked by a 5-bp degenerate sequence. (B) Violin plots of PAM enrichment for five highly active Type I-F3 and a type V-K CRISPR-Tn (Tn6999, also referred to as S. hofmannii INTEGRATE, ShoINT). Lines represent 10-fold enrichment or depletion. *, PAM sequences not detected in the final library. (C) PAM preference is represented by WebLogos for the top 5% enriched PAM sequences, for CRISPR-Tn homologs indicated. PAM sequences are shown for the non-targeted strand, with the −1 position corresponding to the base immediately adjacent to the 5’ end of the target sequence as schematized in A. (D) Integration site distribution obtained from the PAM library data is shown for ‘CC’ PAMs (Tn6677, Tn7007, Tn7011, Tn7014, Tn7016) or ‘GTN’ PAMs (Tn6999) only. d, distance in bp from the 3’ end of the target to the integrated transposon. (E) Integration efficiencies for the CRISPR-Tn homologs and PAMs indicated, normalized to a ‘CC’ PAM. Data are shown as mean ± s.d. for n = 3 biologically independent samples. (F) Recognition of CC PAM by I-F1 Cascade from P. aeruginosa (left; PDB ID 6NE0) and I-F3 TniQ-Cascade (right; PDB ID 6VBW). The guanine base paired with C −1 forms hydrogen bonds with N250 (left) and N246 (right), alongside other subtype-specific contacts. Both systems exploit a positively charged residue (K247 and R243) as a ‘wedge’ to facilitate DNA unwinding. See also Figure S2.
