
FIG. 3. Population-level mortality estimates.
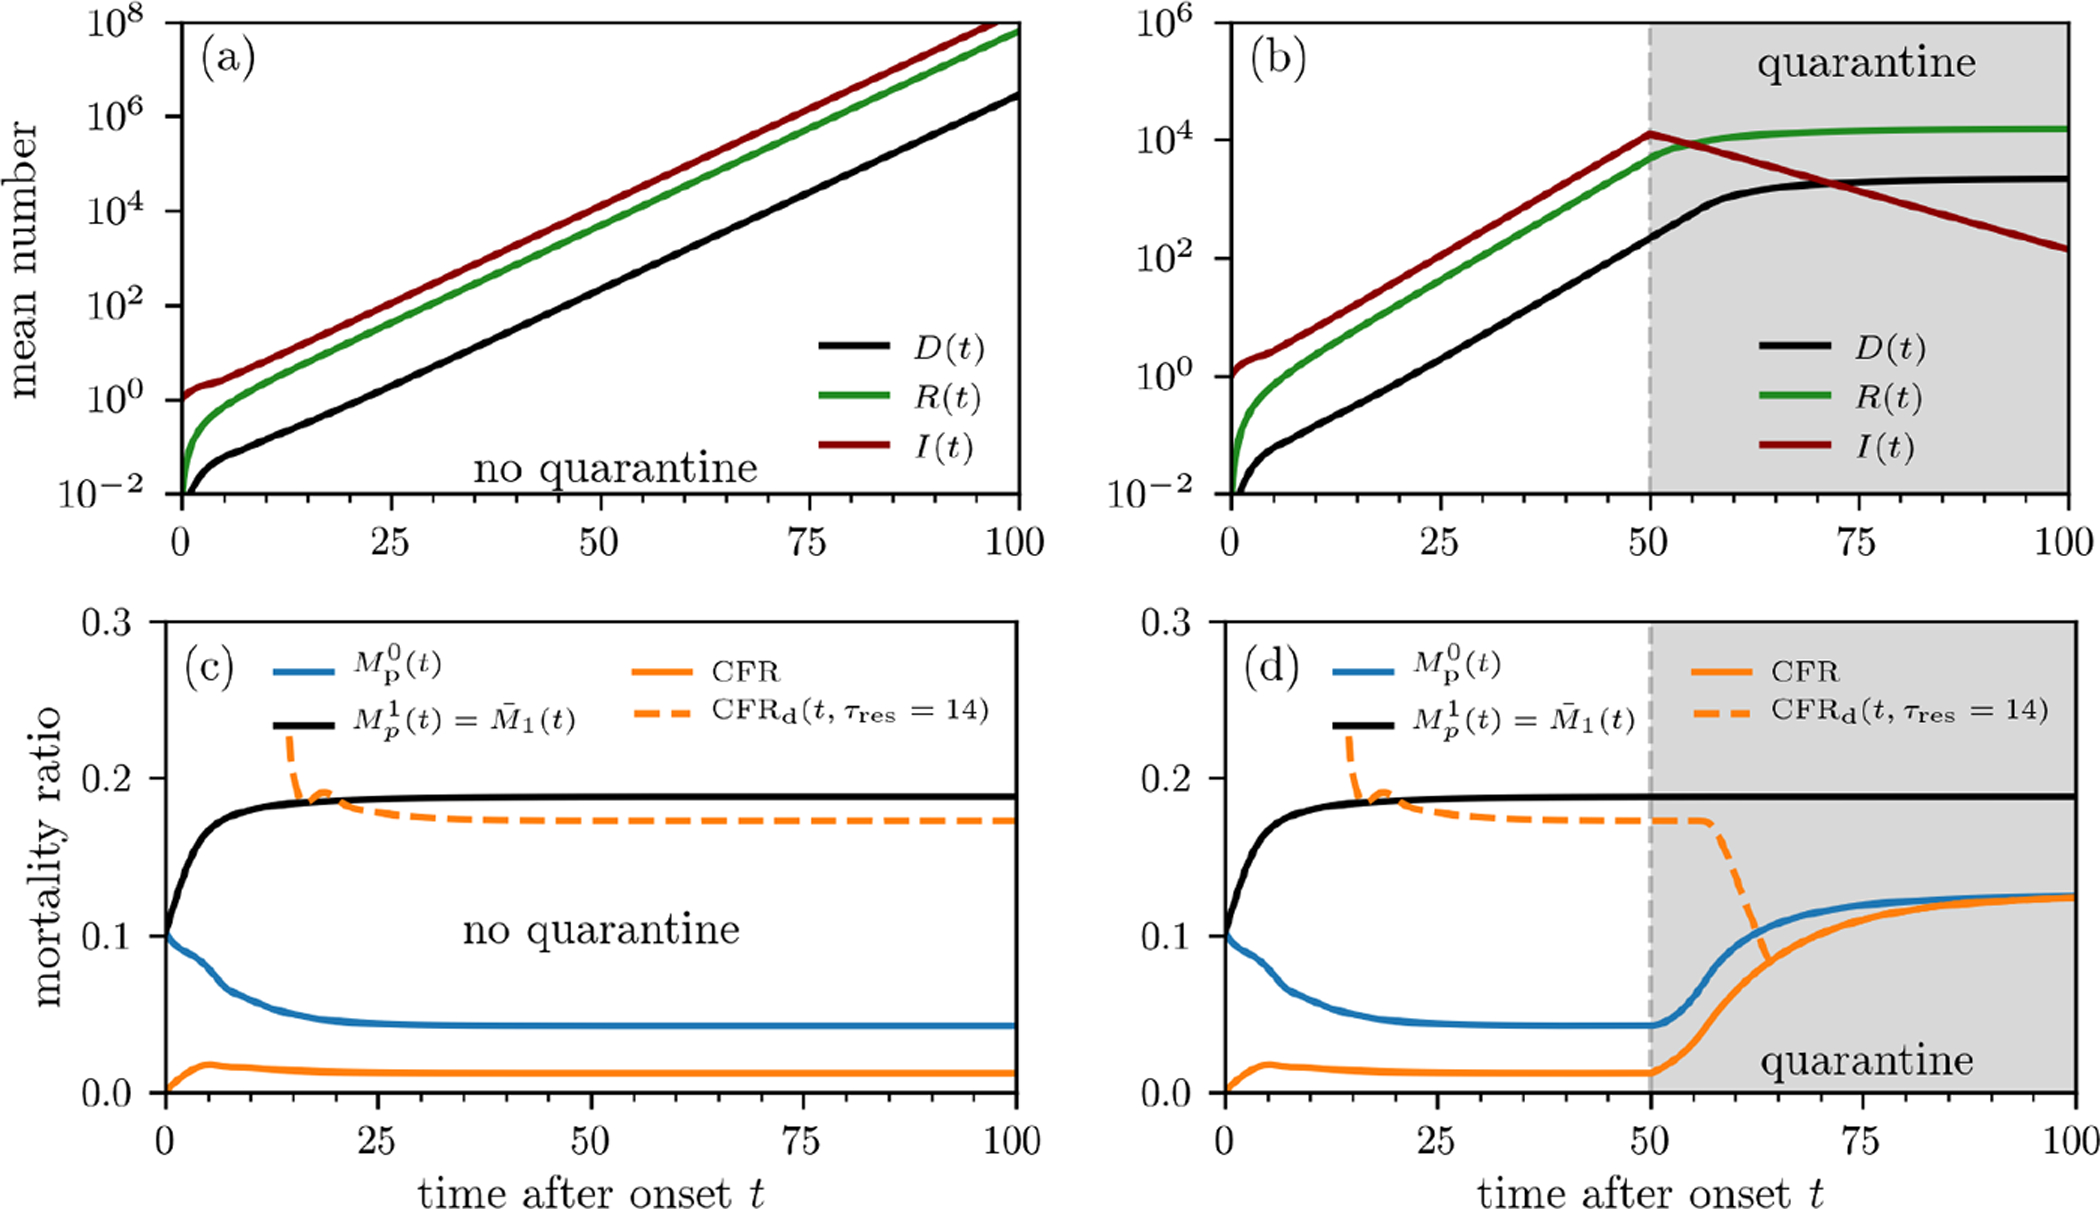
Outbreak evolution and mortality ratios without containment measures (a,c) and with quarantine (b,d). The curves are based on numerical solutions of Eqs. (10) using the initial condition I(τ, 0) = ρ(τ; 8, 1.25) (see Eq. (7)). The death and recovery rates are defined in Eqs. (4) and (5). We use an infection rate (Eq. (16)) defined by β0S0 = 4.64/day, which we estimated from the basic reproduction number of SARS-CoV-2 [36]. To model quarantine effects, we set β0S0 = 0 for t > 50 days. We show the mortality-ratio estimates and (see Eq. (14)) and CFRd(t, τres) (see Eqs. (8), (12), and (14)). CFRd(t, τres = 14 days) behaves very differently from CFR, initially decreasing for τres > 0 and significantly overestimating but providing a reasonable estimate of without quarantine. Note that under quarantine, CFR(∞), CFRd(∞), and approach the same value since they reflect the mortality ratio of the total cohort at the time of quarantine. On the other hand, reflects the ratio of the initial cohort at the start of the outbreak and remains unchanged from the no-quarantine case.