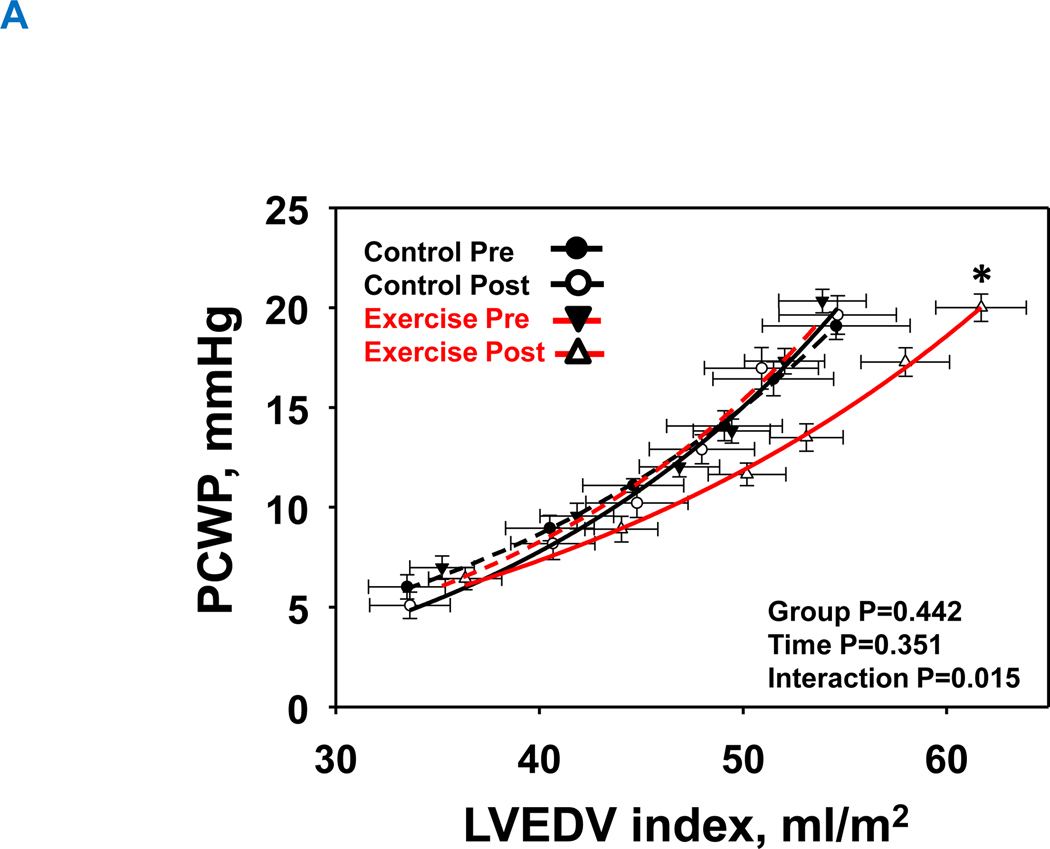
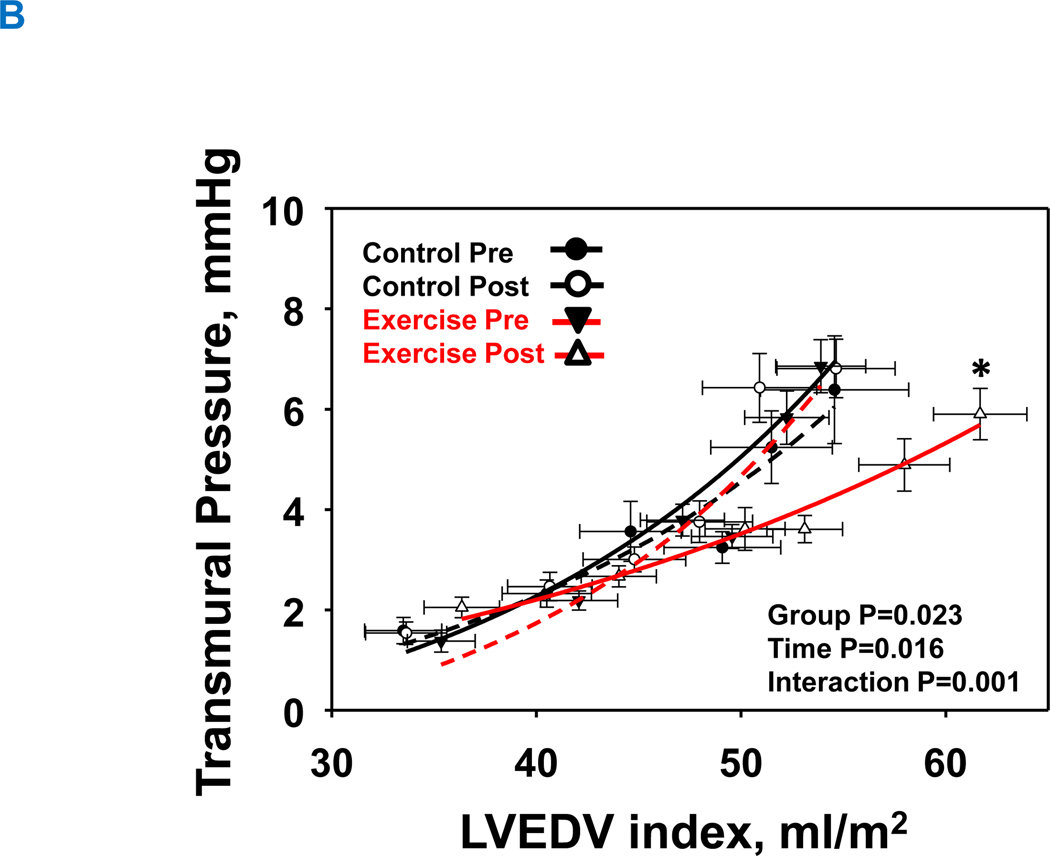
Figure 4. Effect of high-intensity exercise training on left ventricular chamber. (A) and transmural stiffness (B).
The group mean left ventricular pressure-volume relationships before and after 1-year of intervention. Control group at pre, black-dash line with closed black circle; Control group at post, black line with open circle; Exercise group at pre, red-dash line with closed triangle; Exercise group at post, red line with opened circle. In the exercise group, both the LV chamber (A) and LV transmural curves (B) were shifted rightward with a flattening slope demonstrating improved LV compliance and distensibility. Those curves in the control group were unchanged. *P<0.05 denotes significantly different from pre.
LVH, left ventricular hypertrophy group; PCWP, pulmonary capillary wedge pressure; LVEDV was scaled to body surface area, Transmural pressure = PCWP ─ right atrial pressure (RAP).


