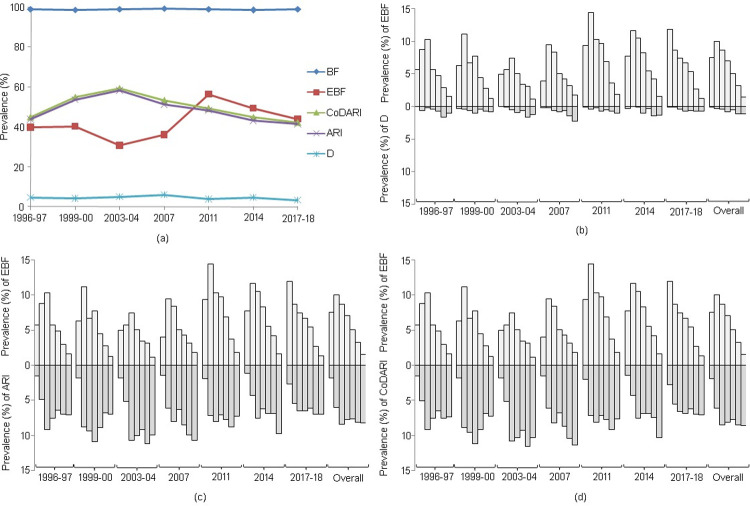
Fig 2. Graphical comparison of the prevalence of D, ARI, and CoDARI with the prevalence of breastfeeding (BF) and EBF.
The figure (a) shows the trend of BF, EBF, D, ARI, and CoDARI over the survey years. The comparison of D, ARI, and CoDARI with EBF are shown in (b), (c), and (d), respectively according to child age in months. In figures (b)-(d), the histogram corresponding to each survey year represents the prevalence for 0 to 6 months of age from left to right.

