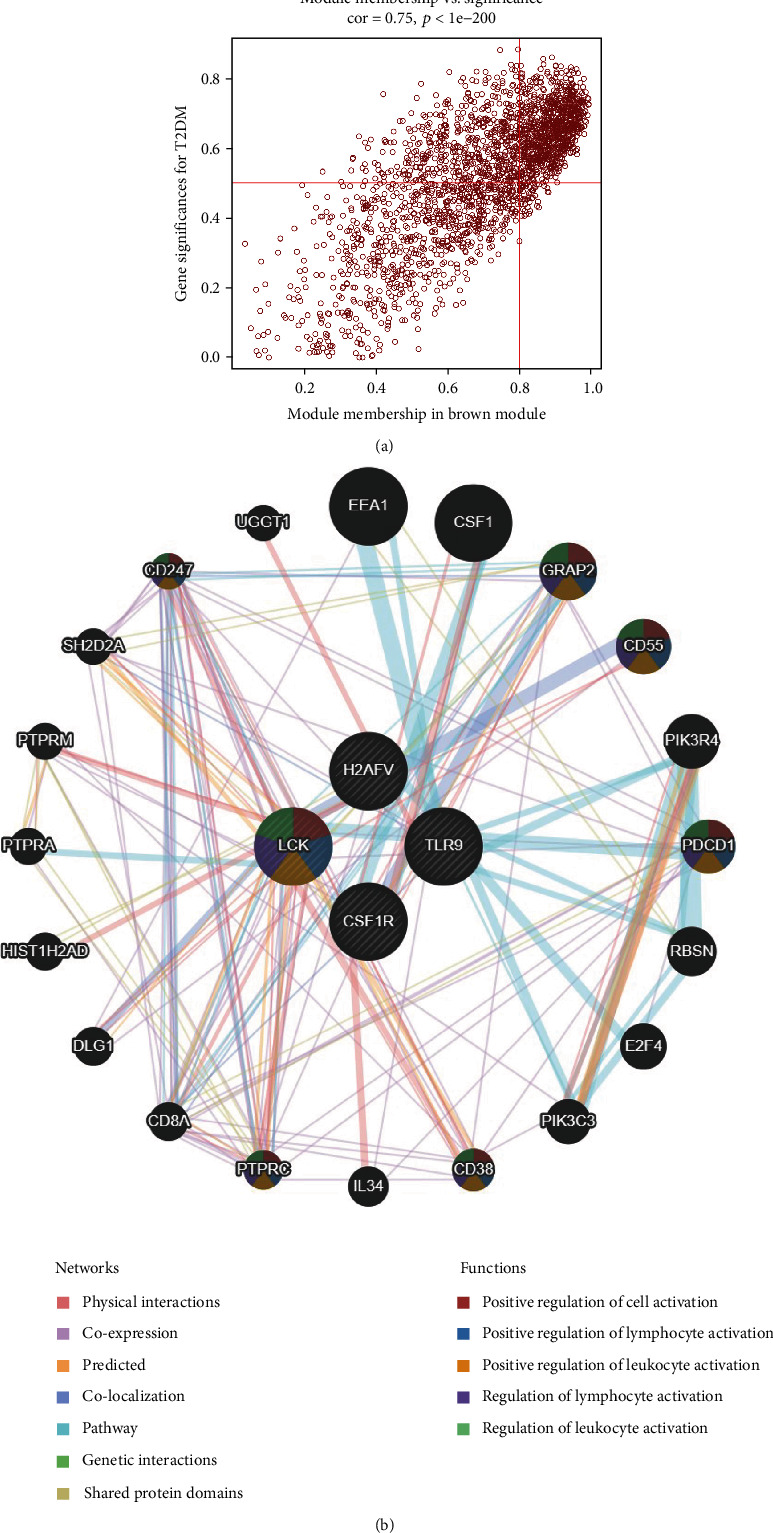
Figure 4.

Identification of hub genes. (a) Scatter plot of brown module genes. Each brown dot represents a gene, and the dots in the red box represent the genes with a module membership > 0.8 and a gene significance score > 0.5. The genes in the red region group are shown in the upper right corner. (b) GeneMANIA network construction. As shown in the figure, the different functions of each gene are represented by different colors in each node.
