

Abstract
In situ quantitative measurements of neurotransmitter activities can provide useful insights into the underlying mechanisms of stem cell differentiation, the formation of neuronal networks, and neurodegenerative diseases. Currently, neurotransmitter detection methods suffer from poor spatial resolution, nonspecific detection, and a lack of in situ analysis. To address this challenge, herein, we first developed a graphene oxide (GO)-hybrid nanosurface-enhanced Raman scattering (SERS) array to detect dopamine (DA) in a selective and sensitive manner. Using the GO-hybrid nano-SERS array, we successfully measured a wide range of DA concentrations (10−4 to 10−9 M) rapidly and reliably. Moreover, the measurement of DA from differentiating neural stem cells applies to the characterization of neuronal differentiation. Given the challenges of in situ detection of neurotransmitters at the single-cell level, our developed SERS-based detection method can represent a unique tool for investigating single-cell signaling pathways associated with DA, or other neurotransmitters, and their roles in neurological processes.
Keywords: Surface-enhanced Raman scattering, Detections of Neurotransmitters, Single-cell analysis, Graphene-hybrid SERS nanobiosensing
Graphical Abstarct
Neurotransmitters are endogenous biochemical messenger molecules that play a vital role in controlling neurophysiological processes such as cognition, memory, and psychological behaviors in the central nervous system (CNS).1 Dopamine (DA), for example, is one of the most common neurotransmitters, which can directly regulate motivational and reward mechanisms, motor function, and cognitive function.2-4 Abnormal levels of DA in the brain have been linked to several neurological diseases such as Parkinson’s disease (PD). Besides this, DA is one of the representative neuronal differentiation markers used to monitor the differentiation process of neural stem cells (NSCs) into dopaminergic neurons (DA-neurons).5 However, conventional methods for detecting neurotransmitters have some drawbacks, including poor selectivity, low sensitivity, and difficulties of detection with a nondestructive method. In particular, a nondestructive detection method for monitoring the release of neurotransmitters during stem cell differentiation and neurogenesis at the single-cell level would be critical for gaining new insights into various cellular interactions in neural networks as well as the stem cell differentiation process. However, because of low concentration levels and various types of neurotransmitters secreted at different neuronal differentiation states, in situ sensing of the release of the target neurotransmitter at the level of single cells in a highly selective and sensitive manner is quite challenging. Even though previous studies commonly used electrochemical detection methods to measure the DA levels in human blood or urine samples,6-8 one critical drawback of electrochemical DA sensing is high signal interference from off-target redox molecules such as ascorbic acid, uric acid, and similar catecholamines in which oxidation and reduction potentials partially overlap with that of DA.
To this end, surface-enhanced Raman scattering (SERS)-based biosensing methods have been introduced as an alternative tool to overcome the limitations of electrochemical methods for DA detection, as well as to improve the detection sensitivity. Typically, Raman peaks are known to be highly specific to the chemical structure of the target molecule and can be significantly amplified in the presence of noble-metal [e.g., gold (Au) and silver (Ag)] nanostructures.9,10 To develop highly sensitive SERS-based DA sensing methods and to overcome the critical challenge of irreproducible Raman intensities, which are often caused by high variations of electromagnetic enhancement,11-14 it is essential to generate SERS-active nanoarrays that contain a uniform size, shape, and well-defined spacing/distribution of noble-metal nanostructures.
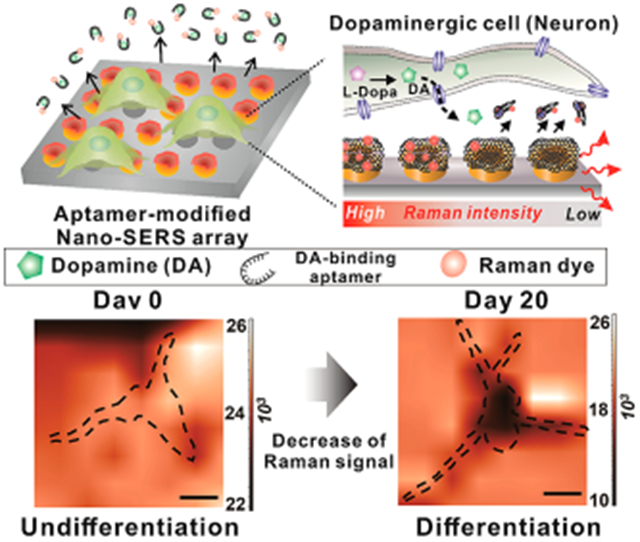
To address the challenges mentioned above in detecting cellular DA efflux from single live cells, herein, we developed a highly selective and sensitive SERS-based sensing platform to detect neurotransmitters (DA molecules) using graphene oxide (GO)-hybrid nano-SERS arrays and performed an in situ, noninvasive investigation of the neurotransmitter (DA) (Figure 1). The GO-hybrid nano-SERS array, whose tooth-like nanostructures were designed to enhance the Raman signal intensity, was fabricated via an advanced nanofabrication method based on laser interference lithography (LIL), followed by electrochemical deposition (ECD), and last modified with GO nanosheets.15,16 GO is an interesting carbon nanomaterial that possesses intrinsic properties that adsorb specific molecules of interest via π–π and electrostatic interactions, which contribute to the amplification of Raman signals to achieve higher sensitivity and selectivity for biosensing platforms.17,18 Compared to conventional electrochemical DA detection systems,6-8,19 our developed hybrid nano-SERS arrays can minimize the chance of detecting false positive signals, reliably monitor DA release from single live cells, and can be potentially used as a tool to investigate subcellular mechanisms of neurotransmitter secretion. Furthermore, our platform is a noninvasive detection method which prevents possible cell damage as opposed to other intracellular methods.
Figure 1.

Schematic diagram illustrating the method to detect dopamine (DA) releasing from single live cells using graphene oxide (GO)-hybrid nano-SERS. (A) Raman-enhancing graphene oxide (GO)-modified hybrid nano-surface-enhanced Raman scattering (SERS) arrays were uniformly generated on the surface of the indium tin oxide electrode via sequential laser interference lithography (LIL) and electrochemical deposition method for in situ monitoring of neural stem cell (NSC) differentiation. (B) Raman dye (malachite green)-labeled aptamer was functionalized on the surface of hybrid nano-SERS array to selectively detect DA based on SERS by electromagnetic (EM) enhancement and chemical (CM) enhancement. (C) The DA released from single dopaminergic neurons differentiated from NSC induces the detachment of Raman dye-labeled aptamers, which results in the decrease of Raman intensity on the Raman-mapping images. It enables in situ detection of DA released from single live cells.
RESULTS AND DISCUSSION
Development of the Hybrid Nano-SERS Platform for the Improvement of SERS-based Signal Generation.
Precise in situ analysis of neurotransmitters via SERS suffers from considerable signal variation due to the difficulties in generating large-scale homogeneous nanostructures. The generation of hot spots, the point at which Raman signals are enhanced with low signal variation, is a direct result of the topographic and geometric arrangement of nanostructures.20-22 We hypothesized that a hybrid nano-SERS array, composed of a large-scale homogeneous array of tooth-like gold nanostructures, could yield a significant Raman enhancement with a low signal variation. We confirmed the successful synthesis of the desired array of tooth-like gold nanostructures through a helium ion microscope (HIM), scanning electron microscope (SEM), and atomic force microscope (AFM) (Figure 2A-C). Furthermore, as our LIL-based fabrication is mask-free, large-scale (over 1.0 by 1.0 cm2) arrays with precise nanostructure control can be generated in a high-throughput manner, as opposed to other techniques that are limited by pattern area. Therefore, we achieved precise size control over the fabricated homogeneous nanostructures (tooth-like gold nanoarray) to promote electromagnetic (EM) enhancement, all of which would be essential for constructing our hybrid nano-SERS array. In addition, Raman signals were measured with four differently shaped nanoarrays with the similar pattern and gap sizes, and it was verified that the hybrid nano-SERS platform structure was the most suitable for enhancing Raman signal intensity due to its structural features that concentrate electrons surrounding each nanostructure (Figure S1).
Figure 2.

The characterization of the hybrid nano-SERS array for the enhancement of Raman intensity. (A) Schematic illustration representing the difference between the large-scale homogeneous gold nanoarrays and the conventional Raman-enhancing substrate that utilizes randomly distributed gold nanoparticles for the control experiment. (B) Helium ion microscopic (HIM) images of hybrid nano-SERS array (right) for Raman enhancement and scanning electron microscopic (SEM) image of randomly distributed spherical gold nanoparticles (left), respectively. Scale bar = 1 μm. (C) Atomic force microscopic (AFM) image of the hybrid nano-SERS array to visualize dimensions of each nanostructure generated on the surface of indium tin oxide (ITO). Scale bar = 500 nm. (D) Raman mapping images (100 μm × 80 μm, at 830 cm−1) of two different GO-modified substrates with (i) hybrid nano-SERS array and (ii) randomly distributed spherical gold nanoparticles. Raman spectra were recorded using a NIR laser-emitting light at a wavelength of 785 nm, with an irradiation laser power of 3 mW for 1 s. Scale bar = 10 μm. (E) Ten different Raman spectra extracted from (D) showing D and G peaks of GO at 1400 cm−1 and 1650 cm−1, respectively. (F) The signal intensity and its variation obtained from the D and G peaks of GO shown in (E). (G) Top and side view of intensity (E/E0) distributions obtained from three-dimensional finite-difference-time-domain calculations at wavelength 780 nm of hybrid structures and randomly distributed spherical gold nanoparticles. Scale bar = 500 nm.
Besides the EM enhancement by the homogeneous nanostructures, chemical (CM) enhancement could be induced by chemical surface modification with moieties such as GO. Therefore, we sought a reliable method for synthesizing hybrid nano-SERS arrays combined with GO coatings on the tooth-like gold nanostructures. GO-based CM enhancement, known as graphene-enhanced Raman scattering (GERS),23-25 has been well-established and can induce the synergistic effect with EM. Additionally, GO serves as an essential adaptor for our hybrid nano-SERS array-based sensing platform, as GO mediates the attachment and selective detachment of the Raman dye-conjugated aptamers in the presence of target analytes (e.g., dopamine).26 Therefore, an efficient and uniform coating of GO on the tooth-like gold nanoarray is fundamentally necessary for achieving optimal SERS signals and ensuring selectivity in dopaminergic neuron cellular sensing. To this end, suspension of small-sized negatively charged GO was incubated with the cysteamine coated, positively charged gold nanoarray to improve its cell attachment properties15,27,28 and to produce a binding affinity between the aptamer and GO surface via a π–π interaction.29 We confirmed our uniform coating method by performing large-scale Raman mapping, in which we observed a strong Raman signal from the D (1350 cm−1) and G (1600 cm−1) bands of the GO with a low signal variation to support the homogeneity of the SERS substrate (Figure 2D-F). As a control, gold nanoparticle aggregates, which typically show substantial EM enhancement, were prepared and tested with Raman mapping. Strikingly, Raman mapping shows that the overall intensities of the hybrid nano-SERS arrays were approximately doubled compared to the random nanoparticle aggregates. While the generation of Raman peaks showed significant variation from the random nanoparticle aggregates, all ten attempts with the hybrid nano-SERS array exhibited similar signal intensities. Moreover, the enhanced homogeneity of our hybrid nano-SERS array is strongly supported by its lower maximum-to-minimum ratio of SERS intensities [1.08 (D band of GO)] compared to the random nanoparticle aggregates [2.35 (D band)]. Regarding the relative standard deviation (RSD) value, the nano-SERS array showed much less RSD (both 3% for D and G bands) than the random spherical nanoparticles (27% and 25% for D and G bands, respectively) due to the homogeneity of the nano-SERS array (Figure 2F). Therefore, by generating the tooth-like gold nanoarray and adapting a solution-based GO coating strategy, our nano-SERS array can serve as an attractive platform for both sensitive and reliable sensing of biomolecules. Interestingly, a theoretical three-dimensional finite-difference-time-domain (FDTD) simulation on the control (randomized gold nanoparticle) and nano-SERS array substrates verified the experimental results (Figure 2G). For instance, whereas randomized gold nanoparticle aggregates only locally increased the field intensity, our hybrid nano-SERS array demonstrated a much more uniform and large-scale enhancement pattern. Based on these results, by overcoming several inherent limitations of current SERS substrates, our developed nano-SERS array is strongly advantageous for highly sensitive and reliable detection of biomolecules.
Quantitative Analysis of DA in Cell-Free Configuration Based on the Hybrid Nano-SERS Platform.
An essential factor for the development of biomolecular detection systems is the incorporation of a target-specific recognition moiety. To this end, antibodies have been widely used as capturing moieties due to their excellent selective binding ability against targeted molecules. Despite these advantages, inherent disadvantages such as poor stability and exposed active sites for antigen binding can limit their translational application.30-32 Moreover, immunoassays often require two different antibodies, which cause difficulties with in situ live-cell, label-free detection. On the other hand, aptamers are more stable to a wider range of temperatures, more readily exposing binding sites than an antibody and needing only a single aptamer for the simultaneous targeting and sensing. Furthermore, after being bound to the surface of GO through π–π interaction, aptamers can be selectively released from GO upon binding to its target molecule due to the aptamer’s conformational change. Therefore, in this study, we utilized a DA-specific aptamer as a targeting and signaling moiety labeled with a Raman dye (malachite green, MG) for signal generation. When the aptamer initiated binding to the DA, the MG-labeled aptamer detached from the hybrid nano-SERS surface, which resulted in the significant decrease of SERS intensity specific to MG (Figure 3A). Therefore, DA could be quantified by the reduction of the MG SERS signal intensity. At four distinct peaks corresponding to MG on the hybrid nano-SERS array (Figure S2), there was a remarkable signal decrease after the reaction with DA (1 μM) (Figure 3C and Figure S3). In contrast, the difference between these peaks was almost negligible in the control GO-coated flat gold substrate conditions due to the weak Raman enhancement effect (Figure 3B). This result proves that our design of the hybrid nano-SERS structure can effectively induce a substantial increase in Raman signal intensity. A comparison of signal intensity with GO-coated flat gold and hybrid nano-SERS array shows that the nano-SERS array performs with an around 80 times stronger signal intensity than the GO-coated flat gold before applying DA (Figure 3D). The hybrid nano-SERS array was designed for enhancing the Raman intensity by inducing a hotspot phenomenon according to the shape of the gold nanostructure, which has a cup-like configuration. On the other hand, the flat gold-GO substrate does not enhance the Raman intensity nor improve the sensitivity for the detection of MG-aptamer desorption. Consequently, an enhanced signal from the hybrid nano-SERS surface can facilitate the highly sensitive detection of DA through a signal change caused by the detachment of MG-labeled aptamer from the GO surface.
Figure 3.

Detection of DA on the flat gold and hybrid nano-SERS array based on Raman spectroscopy. (A) Schematic diagram of the difference of the Raman intensity before and after the addition of DA on the GO modified flat gold substrate and hybrid nano-SERS array. (B, C) Raman spectra of malachite green (MG)-labeled aptamer on GO before and after addition of 1 μM DA using (B) flat gold and (C) hybrid nano-SERS array as supporting substrates. (D) Averaged intensities of four different Raman peaks of MG before and after the addition of DA. The hybrid nano-SERS array shows a clear difference in Raman intensity while the GO-modified flat gold substrate failed to show the difference between before and after the addition of DA. Raman intensities were expressed as the mean ± SEM (n = 10). Raman spectra were recorded using a NIR laser-emitting light at a wavelength of 785 nm, with an irradiation laser power of 3 mW for 1 s.
After the successful detection of DA on the hybrid nano-SERS array, a quantitative assay was conducted with a broad range of DA concentrations (Figure 4A). We confirmed the decrease in Raman signal with the presence of DA after 1 h, a suitable time frame to monitor live cells in situ in a noninvasive manner. All three graphs at each specific Raman peak exhibited linear curves with a correspondingly high R2 value (above 0.96) for accurate and quantitative DA analysis (Figure 4B and C). More interestingly, the range of DA concentration that can be measured by a hybrid nano-SERS array was significantly broader [1 nM to 100 μM] compared to other analytical methods. On the basis of these results, we found that the aptamers readily detached from the GO surface via the DA-specific aptamer interaction, proving that even low nanomolar concentrations of DA existed on the hybrid nano-SERS array. Furthermore, we anticipated that the Raman intensity could decrease within an hour due to its sensitive detection system. Therefore, a time-lapse experiment was conducted using Raman mapping, which resulted in a greater than 70% signal reduction within 40 min (Figure S4). For the verification of the low signal variation, homogeneous signal generation was confirmed by 25 Raman images, whose image sizes was 100 × 100 μm, with an aptamer-MG complex (Figure S5). Raman intensities were stably distributed around 2.4~2.7 × 10⁴ a.u. due to the uniform nanostructured surface of the nano-SERS array. Moreover, the specificity of the hybrid nano-SERS array was validated by the treatment of molecules similar to DA, such as epinephrine, L-dopa, ascorbic acid, and uric acid. As anticipated, SERS intensity did not decrease since the DA aptamer could not interact with the other molecules, whereas DA exhibited drastic decrease of the Raman intensity (Figure S6). In short, the advantages mentioned above verifies that the hybrid nano-SERS array is an excellent biosensing platform for the facile detection of DA in a highly sensitive and selective manner.
Figure 4.

Quantitative measurements of DA in the cell-free configuration and released from single dopaminergic cells. (A) MG-labeled aptamer modified hybrid nano-SERS array was utilized to detect DA based on Raman spectroscopy. Three different peaks of MG were selected as indicators to achieve the linearity of DA concentration and Raman intensity. The signal differences from negative control (0 M of DA) of (B) 830 cm−1, (C) 920 cm−1, and (D) 980 cm−1 were obtained and normalized to GO peaks (G bands) for quantitative measurement of DA. Three different wavelengths were shown to have a high linearity value (R2 ≥ 0.96) for the DA detection based on the surface-enhanced Raman resonance (SERS) signal. The standard deviation of the controls were (B) 0.026, (C) 0.016, and (D) 0.012, respectively. Data were expressed as the mean ± SEM (n = 10). (E) Schematic diagram depicting a strategy to detect DA released from single cells. Cells that released DA showed the mass detachment of Raman dye-modified aptamers on the GO surface, which contribute to a huge decrease in Raman signals that appear in Raman mapping images. (F) Representative Raman images of the (i) Raman mapping and (ii) optical image of single dopaminergic cells at 830 cm−1. The optical image exactly matches with that of the Raman mapping image. Scale bars = 20 μm. (G) Raman signal intensities (830 cm−1) that were obtained from different regions of Raman mapping images that appeared in (B). A single dopaminergic cell shows a clear intensity difference from each of the sections in the Raman spectra (n = 10; *p < 0.01, Student’s unpaired t-test).
In Situ Detection of DA Release from Single Dopaminergic Cells Based on SERS.
To measure DA secretion from single cells, PC-12 and human NSCs, which readily differentiate into neurons, were chosen as model dopaminergic cell lines. PC-12 cells can produce and secrete DA via extracellular vesicles, and the release of DA can quickly be induced through KCl stimulation.33 As such, we hypothesized that the secreted DA from single dopaminergic cells would interact with aptamers bound on the hybrid nano-SERS surface and trigger the dissociation of aptamers from the underlying substrate. Since the aptamers possess Raman dye, the Raman signal will decrease as the binding event occurs between DA and aptamer (Figure 4E). To test our hypothesis, Raman signals were measured from multiple spots (32 × 32 in 50 × 50 μm2) of a PC-12 cultivated hybrid nano-SERS array and reconstructed by Raman mapping to correlate with optical microscopic images of cells as shown in Figure 4F. Overall, Raman signals were significantly decreased intracellularly within the cytosol regions. These results indicate that the secretion of DA from single cells can be measured in situ by SERS on a hybrid nano-SERS array using Raman mapping and quantitative analysis (Figure 4G and Figure S7). Intriguingly, Raman intensities were significantly decreased around the nucleus, not the whole intracellular region. This phenomenon may be caused by the higher release of DA vesicles from intracellular nuclear areas compared to the total cytosol. We anticipate that the KCl-induced burst-release and diffusion of DA vesicles from the endoplasmic reticulum (ER) and Golgi apparatus, where extracellular vesicles are generated near the nucleus,34,35 to the cytosol may reflect the observed distribution in Raman signal intensity. This pattern of signal distribution was also observed during the analysis of Raman mapping on multiple cells localized together on the MG-aptamer-modified hybrid nano-SERS array (Figure S8). These observations show that our platform can define a spatial release profile of DA from single cells and multicellular populations.
To confirm the reproducibility of the hybrid nano-SERS array’s measurements, Raman mapping at 830 cm−1 was conducted with the different cellular shape of PC-12, which is circular in form, successfully confirming the signal reduction inside the cells (Figure S9). Moreover, Raman mapping of the PC-12 cells with nonaptamer-modified hybrid nano-SERS arrays (Figure S10) and nondopaminergic cells (NE-4C) with aptamer-modified hybrid nano-SERS arrays (Figure S11) were conducted for the confirmation of DA-specific detection. In the case of the PC-12 cells without aptamer, the difference in Raman intensity at 830 cm−1 was minimal compared with that which contained aptamer (Figure S10). Interestingly, the Raman signal intensity was slightly higher at the intracellular space than the extracellular region owing to the slight Raman signal generation from several cell components such as the lipid bilayer membrane and intracellular proteins. On the other hand, the nondopaminergic cell exhibited homogeneous mapping trends between intracellular and extracellular regions because it did not interact with the DA-specific aptamer due to the absence of the secreted DA (Figure S11). Cell viability was also tested to check the effect of the Raman mapping, confirming no significant influence on the viability (Figure S12).
In Situ Detection of DA Released from Undifferentiated/Differentiated NSCs.
For monitoring neuronal differentiation, NSCs (ReN cells) were analyzed by Raman mapping using the nano-SERS array (Figure 5A). For continuous analysis of the neuronal differentiation, Raman mapping was conducted once in 4 days for 20 days without KCl treatment, which could damage stem cells. During the differentiation of NSCs, the expression level of a NSC marker (Nestin) was reduced, and a mature neuron marker (MAP-2) was increased (Figure 5B), indicating successful neuronal maturation. As expected, Raman mapping images of the differentiating cells also exhibited a decreasing trend in Raman signals, while the signal differences from undifferentiated NSCs (day 0) were gradually increased (Figure 5C). Compared to the immunostaining analysis in Figure 5B, Raman mapping analysis may be more efficiently utilized to determine the neuronal differentiation by measuring secreted DA from the differentiating cells. In the case of real-time polymerase chain reaction (RT-PCR) analysis, neuronal differentiation was also confirmed by quantification of differentiation markers, including Sox-1 and MAP-2 (Figure 5D). However, the in situ monitoring of differentiation was not possible by PCR due to the cell lysis needed to get specific mRNAs. Besides, typical RT-PCR methods require complicated reaction steps spanning several hours. On the other hand, the intensities of the Raman signal were gradually decreased and demonstrated to be inversely proportional to the neuronal differentiation in a more responsive and noninvasive manner for 20 days (Figure 5E). Based on these results, we speculate that the secretion of DA from a single dopaminergic cell and differentiating NSC was successfully measured using our hybrid nano-SERS array in a noninvasive and nondestructive manner for the determination of the stage of neuronal differentiation.
Figure 5.

In situ detection of DA released from undifferentiated/differentiated NSCs. (A) Schematic diagram depicting a strategy to detect DA released from single neural stem cells, which were differentiating to the neuron for 20 days. (B) Representative immunofluorescence images of the undifferentiated/differentiated NSCs from day 0 to 20 after induction of differentiation. Scale bars = 50 μm. (C) Representative Raman mapping images corresponding to (B) at 830 cm−1. Scale bars = 5 μm. The dotted lines indicate the boundary of the cells. (D) mRNA levels of the Sox-1 and MAP-2 of the differentiated NSCs, which were corresponded to (B) and (C) (n = 5; *p < 0.01, Student’s unpaired t-test). (E) Raman signal intensities (830 cm −1) that were obtained from different regions of Raman mapping images that appeared in (C) (n = 10; *p < 0.01, Student’s unpaired t-test).
CONCLUSION
In this study, we successfully developed a highly sensitive and selective in situ detection system to monitor the DA secretion from dopaminergic cells, including NSCs, at the single-cell level using the SERS analytical method. To overcome an inherent drawback of high signal intensity variations in SERS biosensing, we have fabricated finely tuned homogeneous gold nanoarrays with tooth-like structures, which can enhance the Raman signal intensity uniformly. For the specific detection of DA, Raman dye-labeled aptamers were bound onto the surface of the hybrid nano-SERS array. The presence of DA can release the aptamer from the GO surface by forming a DA-aptamer complex. The subsequent decrease of Raman intensity due to the detachment of Raman dye (MG)-labeled aptamer was proportional to the DA concentrations. As a result, our sensing platform can measure a wide range of DA concentrations (10−4 to 10−9 M) rapidly (within 1 h). Additionally, the release of DA from single dopaminergic cells (PC-12) and NSCs were successfully measured. More specifically, neuronal differentiation could be determined by measuring the decrease of Raman signals in situ in a spatially controlled and highly sensitive manner. Moving forward, our demonstration of sensitive and selective DA detection in live cells could lead to breakthroughs in stem cell therapies for CNS diseases such as PD, by validating the therapeutic effects of dopaminergic cells before their transplantation into patients. In general, our nano-SERS array represents a novel live-cell sensing platform and may pave new roads for understanding and treating many devastating neurological disorders.
Supplementary Material
ACKNOWLEDGMENTS
This work was supported by the NSF (CHE-1429062 and CBET-1803517), the New Jersey Commission on Spinal Cord (CSCR17IRG010; CSCR16ERG019), NIH R21 (R21AR071101), and NIH R01 (1R01DC016612, 3R01DC016612-01S1, and 5R01DC016612-02S1), and the National Research Foundation of Korea (NRF) (2019R1A2C3002300, 2016R1A6A1A03012845) funded by MSIT of Korea.
ABBREVIATIONS
- GO
graphene oxide
- SERS
surface-enhanced Raman scattering
- DA
dopamine
- LIL
laser interference lithography
- ECD
electrochemical deposition methods
- MG
malachite green
- ITO
indium tin oxide
- DC
direct current
- SEM
scanning electron microscope
- AFM
atomic force microscopy
- ER
endoplasmic reticulum
- PDMS
polydimethylsiloxane
- PBS
phosphate buffered saline
- DMEM
Dulbecco’s modified Eagle’s medium
- PS
penicillin/streptomycin
- DIW
deionized water
- HMDS
hexamethyldisilazane
- RT
room temperature
Footnotes
The authors declare no competing financial interest.
Supporting Information
The Supporting Information is available free of charge at https://pubs.acs.org/doi/10.1021/acs.nanolett.0c03205.
Experimental section and Figures S1-S12 (PDF)
Contributor Information
Jin-Ha Choi, Department of Chemistry and Chemical Biology, Rutgers, The State University of New Jersey, Piscataway, New Jersey 08854, United States; Department of Chemical & Biomolecular Engineering, Sogang University, Seoul 04107, Republic of Korea.
Tae-Hyung Kim, Department of Chemistry and Chemical Biology, Rutgers, The State University of New Jersey, Piscataway, New Jersey 08854, United States.
Waleed Ahmed El-said, Department of Chemical & Biomolecular Engineering, Sogang University, Seoul 04107, Republic of Korea; Department of Chemistry, Faculty of Science, Assiut University, Assiut 71516, Egypt.
Jin-Ho Lee, Department of Chemistry and Chemical Biology, Rutgers, The State University of New Jersey, Piscataway, New Jersey 08854, United States; Department of Chemical & Biomolecular Engineering, Sogang University, Seoul 04107, Republic of Korea.
Letao Yang, Department of Chemistry and Chemical Biology, Rutgers, The State University of New Jersey, Piscataway, New Jersey 08854, United States.
Brian Conley, Department of Chemistry and Chemical Biology, Rutgers, The State University of New Jersey, Piscataway, New Jersey 08854, United States.
Jeong-Woo Choi, Department of Chemical & Biomolecular Engineering, Sogang University, Seoul 04107, Republic of Korea.
Ki-Bum Lee, Department of Chemistry and Chemical Biology, Rutgers, The State University of New Jersey, Piscataway, New Jersey 08854, United States.
REFERENCES
- (1).Sarter M; Parikh V Choline transporters, cholinergic transmission and cognition. Nat. Rev. Neurosci 2005, 6, 48–56. [DOI] [PubMed] [Google Scholar]
- (2).Yuan M; Cross SJ; Loughlin SE; Leslie FM Nicotine and the adolescent brain. J. Physiol 2015, 593, 3397–3412. [DOI] [PMC free article] [PubMed] [Google Scholar]
- (3).Snyder SH; Taylor KM; Coyle JT; Meyerhoff JL The role of brain dopamine in behavioral regulation and the actions of psychotropic drugs. Am. J. Psychiatry 1970, 127, 199–207. [DOI] [PubMed] [Google Scholar]
- (4).Shafiei G; Zeighami Y; Clark CA; Coull JT; Nagano-Saito A,; Leyton M; Dagher A; Mišić B Dopamine signaling modulates the stability and integration of intrinsic brain networks. Cereb. Cortex 2019, 29, 397–409. [DOI] [PMC free article] [PubMed] [Google Scholar]
- (5).Zeng X; Cai J; Chen J; Luo Y; You ZB; Fotter E; Wang Y; Harvey B; Miura T; Backman C; Chen GJ; Rao MS; Freed WJ Dopaminergic differentiation of human embryonic stem cells. Stem Cells 2004, 22, 925–940. [DOI] [PubMed] [Google Scholar]
- (6).Yang J; Hu Y; Li Y Molecularly imprinted polymer-decorated signal on-off ratiometric electrochemical sensor for selective and robust dopamine detection. Biosens. Bioelectron 2019, 135, 224–230. [DOI] [PubMed] [Google Scholar]
- (7).Kim TH; Lee KB; Choi JW 3D graphene oxide-encapsulated gold nanoparticles to detect neural stem cell differentiation. Biomaterials 2013, 34, 8660–8670. [DOI] [PMC free article] [PubMed] [Google Scholar]
- (8).Ivanova MN; Grayfer ED; Plotnikova EE; Kibis LS; Darabdhara G; Boruah PK; Das MR; Fedorov VE Pt-decorated boron nitride nanosheets as artificial nanozyme for detection of dopamine. ACS Appl Mater. Interfaces 2019, 11, 22102–22112. [DOI] [PubMed] [Google Scholar]
- (9).von Maltzahn G; Centrone A; Park JH; Ramanathan R; Sailor MJ; Hatton TA; Bhatia SN SERS-coded gold nanorods as a multifunctional platform for densely multiplexed near-infrared imaging and photothermal heating. Adv. Mater 2009, 21, 3175–3180. [DOI] [PMC free article] [PubMed] [Google Scholar]
- (10).Kneipp K; Kneipp H; Itzkan I; Dasari RR; Feld MS Ultrasensitive chemical analysis by Raman spectroscopy. Chem. Rev 1999, 99, 2957–2976. [DOI] [PubMed] [Google Scholar]
- (11).Lv Y; Qin Y; Svec F; Tan T Molecularly imprinted plasmonic nanosensor for selective SERS detection of protein biomarkers. Biosens. Bioelectron 2016, 80, 433–441. [DOI] [PubMed] [Google Scholar]
- (12).Luo Y; Ma L; Zhang X; Liang A; Jiang Z SERS detection of dopamine using label-free acridine red as molecular probe in reduced graphene oxide/silver nanotriangle sol substrate. Nanoscale Res. Lett 2015, 10, 230. [DOI] [PMC free article] [PubMed] [Google Scholar]
- (13).Wang P; Xia M; Liang O; Sun K; Cipriano AF; Schroeder T; Liu H; Xie YH Label-free SERS selective detection of dopamine and serotonin using graphene-Au nanopyramid heterostructure. Anal. Chem 2015, 87, 10255–10261. [DOI] [PubMed] [Google Scholar]
- (14).Qiao X; Xue Z; Liu L; Liu K; Wang T Superficial-Layer-Enhanced Raman Scattering (SLERS) for Depth Detection of Noncontact Molecules. Adv. Mater 2019, 31, 1804275. [DOI] [PubMed] [Google Scholar]
- (15).Kim TH; Yea CH; Chueng ST; Yin PT; Conley B; Dardir K; Pak Y; Jung GY; Choi JW; Lee KB Large-Scale Nanoelectrode Arrays to Monitor the Dopaminergic Differentiation of Human Neural Stem Cells. Adv. Mater 2015, 27, 6356–6362. [DOI] [PMC free article] [PubMed] [Google Scholar]
- (16).Yang L; Lee J-H; Rathnam C; Hou Y; Choi J-W; Lee K-B Dual-Enhanced Raman Scattering-Based Characterization of Stem Cell Differentiation Using Graphene-Plasmonic Hybrid Nanoarray. Nano Lett. 2019, 19, 8138–8148. [DOI] [PubMed] [Google Scholar]
- (17).Zhou M; Zhai Y; Dong S Electrochemical sensing and biosensing platform based on chemically reduced graphene oxide. Anal. Chem 2009, 81, 5603–5613. [DOI] [PubMed] [Google Scholar]
- (18).Tang LH; Wang Y; Li YM; Feng HB; Lu J; Li JH Preparation, structure, and electrochemical properties of reduced graphene sheet films. Adv. Funct. Mater 2009, 19, 2782–2789. [Google Scholar]
- (19).Alwarappan S; Erdem A; Liu C; Li CZ Probing the electrochemical properties of graphene nanosheets for biosensing applications. J. Phys. Chem. C 2009, 113, 8853–8857. [Google Scholar]
- (20).Le Ru E; Meyer M; Blackie E; Etchegoin P Advanced aspects of electromagnetic SERS enhancement factors at a hot spot. J. Raman Spectrosc 2008, 39, 1127–1134. [Google Scholar]
- (21).Heck C; Kanehira Y; Kneipp J; Bald I Placement of Single Proteins within the SERS Hot Spots of Self-Assembled Silver Nanolenses. Angew. Chem., Int. Ed 2018, 57, 7444–7447. [DOI] [PubMed] [Google Scholar]
- (22).Fusco Z; Bo RH; Wang YL; Motta N; Chen HJ; Tricoli A Self-assembly of Au nano-islands with tuneable organized disorder for highly sensitive SERS. J. Mater. Chem. C 2019, 7, 6308–6316. [Google Scholar]
- (23).Huang SX; Pandey R; Barman I; Kong J; Dresselhaus M Raman enhancement of blood constituent proteins using graphene. ACS Photonics 2018, 5, 2978–2982. [Google Scholar]
- (24).Liu D; Chen X; Hu Y; Sun T; Song Z; Zheng Y; Cao Y; Cai Z; Cao M; Peng L; Huang Y; Du L; Yang W; Chen G; Wei D; Wee ATS; Wei D Raman enhancement on ultra-clean graphene quantum dots produced by quasi-equilibrium plasma-enhanced chemical vapor deposition. Nat. Commun 2018, 9, 193. [DOI] [PMC free article] [PubMed] [Google Scholar]
- (25).Ling X; Zhang J First-Layer Effect in Graphene-Enhanced Raman Scattering. Small 2010, 6, 2020–2025. [DOI] [PubMed] [Google Scholar]
- (26).Lu CH; Yang HH; Zhu CL; Chen X; Chen GN A graphene platform for sensing biomolecules. Angew. Chem., Int. Ed 2009, 48, 4785–4881. [DOI] [PubMed] [Google Scholar]
- (27).Liu X; Miller AL 2nd; Park S; George MN; Waletzki BE; Xu H; Terzic A; Lu L Two-dimensional black phosphorus and graphene oxide nanosheets synergistically enhance cell proliferation and osteogenesis on 3D printed scaffolds. ACS Appl. Mater. Interfaces 2019, 11, 23558–23572. [DOI] [PMC free article] [PubMed] [Google Scholar]
- (28).Qian Y; Song J; Zhao X; Chen W; Ouyang Y; Yuan W; Fan C 3D fabrication with integration molding of a graphene oxide/polycaprolactone nanoscaffold for neurite regeneration and angiogenesis. Adv. Sci 2018, 5, 1700499. [DOI] [PMC free article] [PubMed] [Google Scholar]
- (29).Lu C; Liu Y; Ying Y; Liu J Comparison of MoS2, WS2, and graphene oxide for DNA adsorption and sensing. Langmuir 2017, 33, 630–637. [DOI] [PubMed] [Google Scholar]
- (30).Jung Y; Jeong JY; Chung BH Recent advances in immobilization methods of antibodies on solid supports. Analyst 2008, 133, 697–701. [DOI] [PubMed] [Google Scholar]
- (31).Jiskoot W; Beuvery EC; de Koning AA; Herron JN; Crommelin DJ Analytical approaches to the study of monoclonal antibody stability. Pharm. Res 1990, 07, 1234–1241. [DOI] [PubMed] [Google Scholar]
- (32).Choi JH; Kim HS; Choi JW; Hong JW; Kim YK; Oh BK A novel Au-nanoparticle biosensor for the rapid and simple detection of PSA using a sequence-specific peptide cleavage reaction. Biosens. Bioelectron 2013, 49, 415–419. [DOI] [PubMed] [Google Scholar]
- (33).Okuma Y; Osumi Y KCl-induced calcium-independent release of endogenous dopamine from rat brain slices. Brain Res. 1986, 363, 47–52. [DOI] [PubMed] [Google Scholar]
- (34).Locke M; Huie P The beads in the Golgi complex-endoplasmic reticulum region. J. Cell Biol 1976, 70, 384–394. [DOI] [PMC free article] [PubMed] [Google Scholar]
- (35).Al-Bassam S; Xu M; Wandless TJ; Arnold DB Differential trafficking of transport vesicles contributes to the localization of dendritic proteins. Cell Rep. 2012, 2, 89–100. [DOI] [PMC free article] [PubMed] [Google Scholar]
Associated Data
This section collects any data citations, data availability statements, or supplementary materials included in this article.