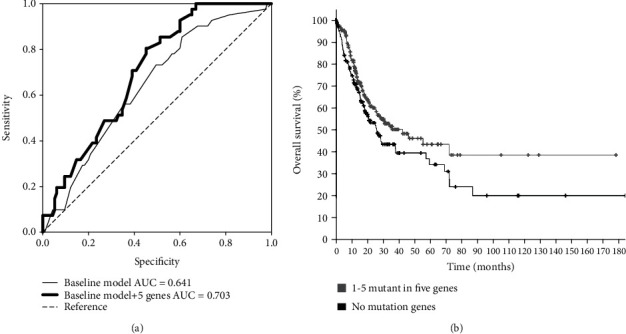
Figure 4.

The verified ROC curve and Kaplan-Meier survival analysis. (a) Recurrence prediction with ROC (receiver operating characteristic) analysis in the validation cohort. The baseline model was established according to the patient's age, tumor stage, grade, gender, and race. The AUC (area under curve) was 0.641. After adding the five-gene prognostic panel to the baseline model, the AUC was 0.703, and the p value was less than 0.05. (b) Kaplan-Meier survival analysis with the five-gene prognostic panel in the validation cohort. Survival of patients with at least one mutation in the five genes showed significant longer survival time than those without mutations in these five genes (no mutant genes), p < 0.05.
