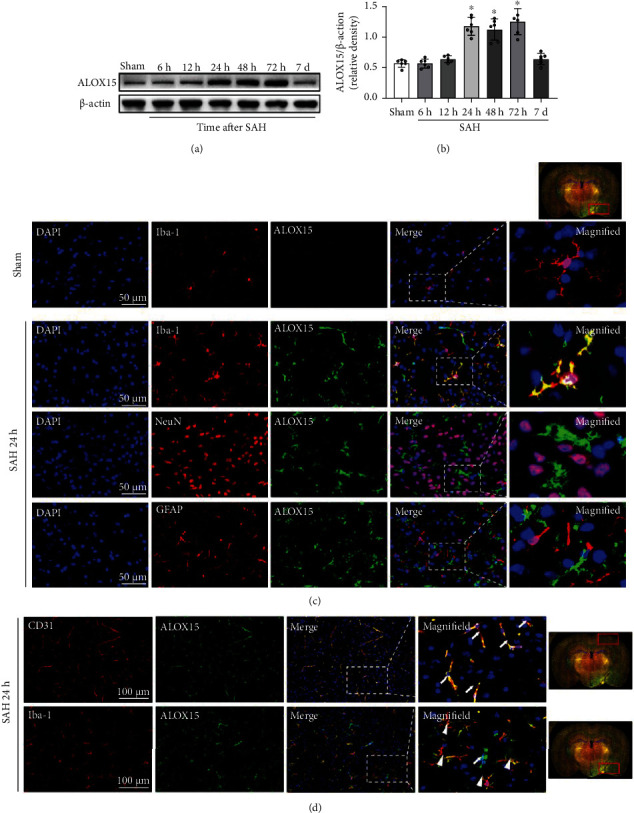
Figure 2.

Times course, spatial expression, and cellular localization of ALOX15 after SAH. (a, b) Representative Western blot images and densitometric quantification of time-dependent expression of ALOX15 after SAH. Data are expressed as mean ± SD, ∗p < 0.05 vs. sham group, n = 6 per group. (c, d) Representative photographs of colocalization of ALOX15 (green) with neurons (NeuN, red), astrocytes (GFAP, red), microglia (Iba-1, red), and endothelial cell (CD31, red) in the left hemisphere (injury ipsilateral) at 24 h after SAH modeling. Nuclei were stained with DAPI (blue). White arrow represents ALOX15 colocalizing with microvascular endothelium, and white triangle represents ALOX15 colocalizing with microglia. Right whole brain scan image indicates the location of staining in the brain (small red box), scale bar = 50 μm, n = 3 per group.
