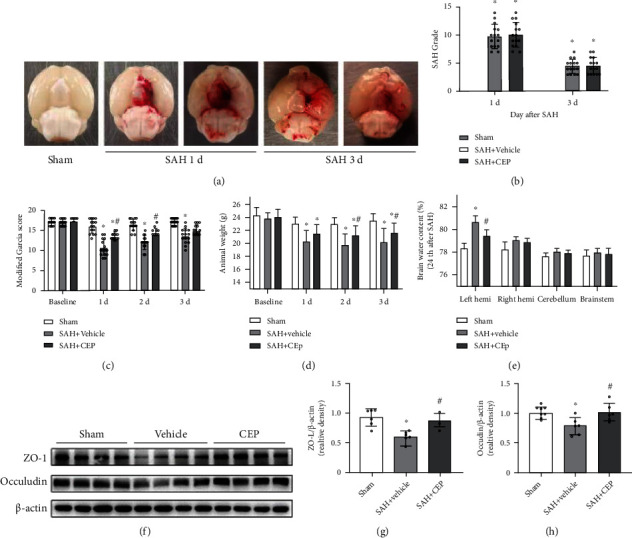
Figure 3.

The effects CEP on SHA grade, neurological performance, brain edema, and BBB disruption after SAH. (a) Representative brain images from the SAH+vehicle and SAH+CEP groups. (b) The quantification of SAH grade. n = 15 per group. (c, d) Modified Garcia score and animal body weight evaluated at 1 d, 2 d, and 3 d after SAH modeling. ∗p < 0.05 vs. sham, #p < 0.05 vs. SAH+vehicle, n = 15 per group. (e) Quantification of brain water content in the left hemisphere, right hemisphere, cerebellum, and brain stem at 24 h after SAH. ∗p < 0.05 vs. sham, #p < 0.05 vs. SAH+vehicle, n = 6 per group. (f–h) Representative Western blot bands and densitometric quantification of tight junction proteins (ZO-1 and occludin). ∗p < 0.05 vs. sham. #p < 0.05 vs. SAH+vehicle, n = 6 per group.
