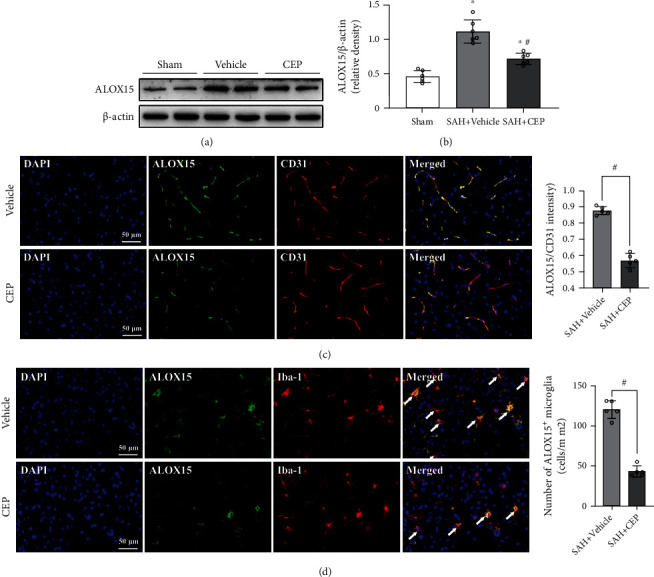
Figure 5.

The effects CEP on ALOX15 expression inhibition after SAH. (a, b) Representative Western blot bands and densitometric quantification of ALOX15. ∗p < 0.05 vs. sham, #p < 0.05 vs. SAH+vehicle, n = 6 per group. (c) Images of ALOX15/CD31 staining in the left hemisphere and quantitative analysis. #p < 0.05 vs. SAH+vehicle, scale bar = 50 μm, n = 5 per group. (d) Images of ALOX15 and Iba-1 immunostaining and quantitative analysis of ALOX15-positive microglia. #p < 0.05 vs. SAH+vehicle, scale bar = 50 μm, n = 5 per group.
