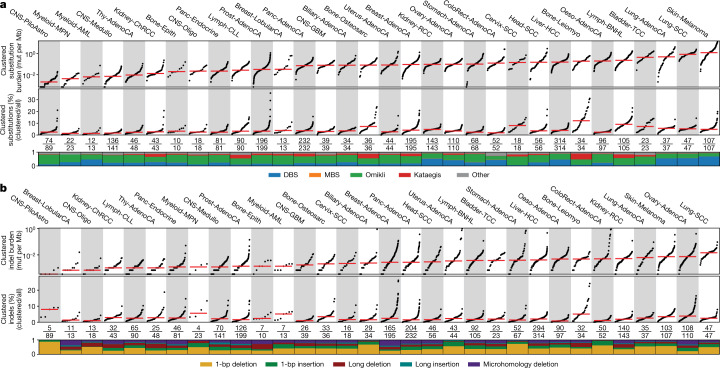
Fig. 1. The landscape of clustered mutations across human cancer.
a, Pan-cancer distribution of clustered substitutions subclassified into DBSs, MBSs, omikli, kataegis and other clustered mutations. Top, each black dot represents a single cancer genome. Red bars reflect the median clustered TMB (mutations (mut) per Mb) for cancer types. Middle, the clustered TMB normalized to the genome-wide TMB reflecting the contribution of clustered mutations to the overall TMB of a given sample. Red bars reflect the median contribution for cancer types. Bottom, the proportion of each subclass of clustered events for a given cancer type with the total number of samples having at least a single clustered event over the total number of samples within a given cancer cohort. b, Pan-cancer distribution of clustered small indels. The top and middle panels have the same information as a. Bottom, the proportion of each cluster type of indel for a given cancer type with the total number of samples having at least a single clustered indel over the total number of samples within a given cancer cohort. All 2,583 whole-genome-sequenced samples from PCAWG are included in the analysis; however, cancers with fewer than 10 samples were removed from the main figure and included in Extended Data Fig. 1d. For definitions of abbreviations for cancer types used in the figures, see 'Cancer-type abbreviations' in Methods.

