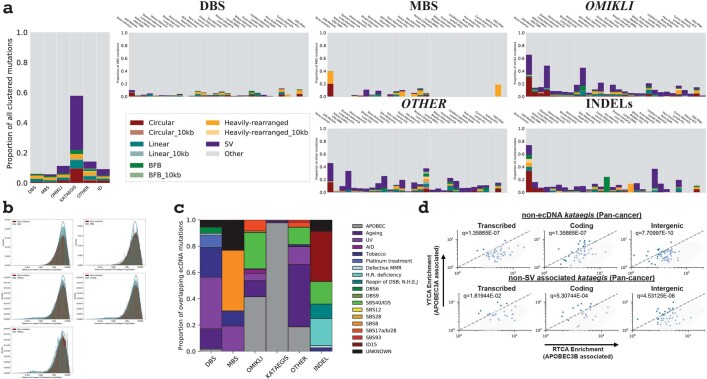
Extended Data Fig. 6. Clustered events and structural variations.
a, The proportion of all clustered events co-locating with structural variations across all cancer types (left) and across each cancer type (right). b, The distance to the nearest structural variation for each class of clustered mutations (teal), and non-clustered mutations (red). The distribution for each class of clustered events were modelled using a Gaussian mixture (blue line). DBSs and MBSs were modelled using a single distribution, whereas omikli, other, and indels were modelled using two components reflecting the minimal distribution of overlap with structural variations. c, The mutational signatures active in ecDNA clustered events. d, YTCA versus RTCA enrichments per sample within non-ecDNA kataegis (top) and non-SV associated kataegis (bottom), where YTCA and RTCA enrichment is suggestive of APOBEC3A or APOBEC3B activity, respectively. Genic mutations were divided into transcribed (template strand) and coding mutations. The RTCA/YTCA fold enrichments were compared to the fold enrichments of non-clustered mutations (p-values calculated using two-tailed Mann–Whitney U-tests and corrected for multiple hypothesis testing using the Benjamini–Hochberg FDR procedure).

