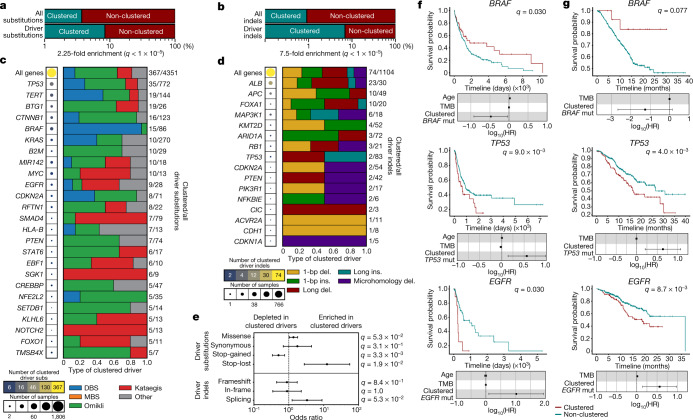
Fig. 3. Panorama of clustered driver mutations in human cancer.
a, b, Percentage of clustered mutations (top) compared to the percentage of clustered driver events (bottom) for substitutions (a) and indels (b). c, The frequency of clustered driver events across known cancer genes. The radius of the circle is proportional to the number of samples with a clustered driver mutation within a gene; the colour reflects the clustered mutational burden. All clustered driver events are classified into one of the five clustered classes, with the number of clustered driver substitutions and the total number of driver substitutions shown on the right. d, Clustered indel drivers are shown in a similar manner to c. e, The odds ratio of clustered substitutions (top) and indels (bottom) resulting in deleterious (n = 192 clustered substitutions; n = 54 clustered indels) or synonymous changes (n = 5 clustered substitutions; n = 5 clustered indels) within a given driver gene compared to non-clustered driver mutations (n = 771 deleterious and n = 237 synonymous substitutions; n = 111 deleterious and n = 50 synonymous indels). All events were overlapped with the PCAWG consensus list of driver events and were annotated using the ENSEMBL Variant Effect Predictor (VEP). The odds ratios are shown with their 95% confidence intervals. f, Kaplan–Meier survival curves comparing the outcome of samples with clustered versus non-clustered mutations in BRAF (top), TP53 (middle) and EGFR (bottom) across TCGA cohorts. Only cohorts with more than five samples containing a clustered mutation within the given gene were included. g, Kaplan–Meier survival curves comparing the outcome of samples with clustered versus non-clustered mutations in the same genes across the MSK-IMPACT cohort. The log10-transformed hazards ratios (log10(HR)) are shown with their 95% confidence intervals in f, g. Cox regressions were corrected for age (TCGA only), mutational burden and cancer type (Methods). Q values in a, b, e were calculated using a two-tailed Fisher’s exact test and corrected for multiple hypothesis testing.

