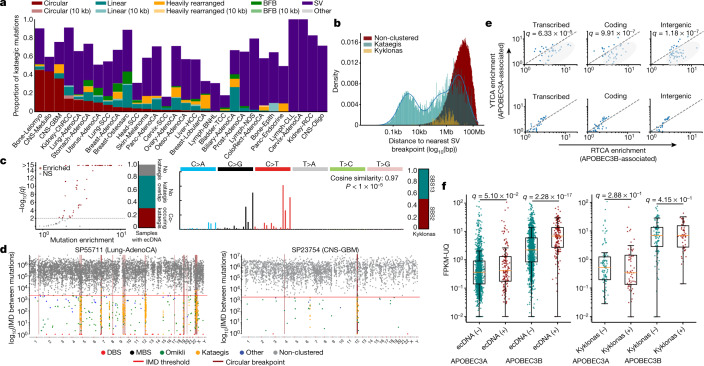
Fig. 4. Kataegic events co-locate with most forms of structural variation.
a, Proportion of all kataegic events per cancer type overlapping different amplifications or structural variations. b, Distance to the nearest breakpoint for all kataegic mutations (teal), kyklonas (gold) and non-clustered mutations (red). Kataegic distances were modelled as a Gaussian mixture with three components (blue line). c, Left, volcano plot depicting samples that are statistically enriched for kyklonas (red; q-values from a false discovery rate (FDR)-corrected z-test; not significant (NS)). Middle left, proportion of samples with ecDNA co-occurring with kataegis. Middle right, mutational spectrum of all kyklonas. Right, proportion of kyklonic events attributed to SBS2 and SBS13. Cosine similarity was calculated between the kyklonic and the reconstructed spectra composed using SBS2 and SBS13 (P value from a Z-score test). d, Rainfall plots illustrating the IMD distribution for a given sample with the genomic locations of ecDNA breakpoints (maroon). e, Top, YTCA versus RTCA enrichments per sample with kyklonas, in which YTCA or RTCA enrichment is suggestive of higher APOBEC3A or APOBEC3B activity, respectively. Genic mutations were divided into transcribed (template strand) and coding mutations. The RTCA/YTCA fold enrichments were compared to those of non-clustered mutations (bottom). f, Relative expression of APOBEC3A and APOBEC3B in samples containing ecDNA (n = 157) compared to samples without ecDNA (n = 1,364) (left), and in samples with ecDNA that have kyklonas (n = 59) compared to samples without kyklonas (n = 98) (right). Expression values were normalized using fragments per kilobase of exon per million mapped fragment (FPKM) and upper quartile (UQ) normalization obtained from the PCAWG release. Q values in e, f were calculated using a two-tailed Mann–Whitney U-test and FDR corrected using the Benjamini–Hochberg procedure. For box plots, the middle line reflects the median, the lower and upper bounds of the box correspond to the first and third quartiles, and the lower and upper whiskers extend from the box by 1.5× the interquartile range.

