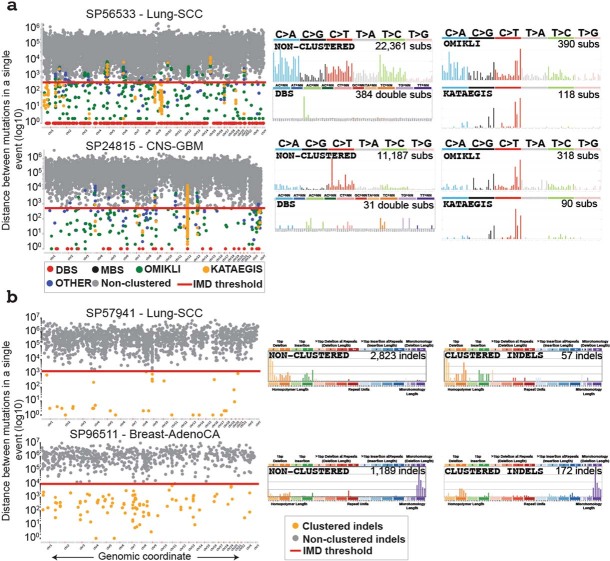
Extended Data Fig. 4. Examples of clustered mutational signatures.
a, Two samples depicting the intra-mutational distance (IMD) distributions of substitutions across genomic coordinates, where each dot represents the minimum distance to adjacent mutations for a selected mutation coloured based on the corresponding subclassification of event (rainfall plot; left). The red lines depict the sample-dependent IMD threshold for each sample. Specific clustered mutations may be above this threshold based on corrections for regional mutation density. The mutational spectra for the different catalogues of clustered and non-clustered substitutions for each sample (right; MBS are not shown). b, Two samples illustrating the IMD distributions of indels across the given genomes, with the IMD indel thresholds shown in red (left). The non-clustered and clustered indel catalogues for each sample (right).

