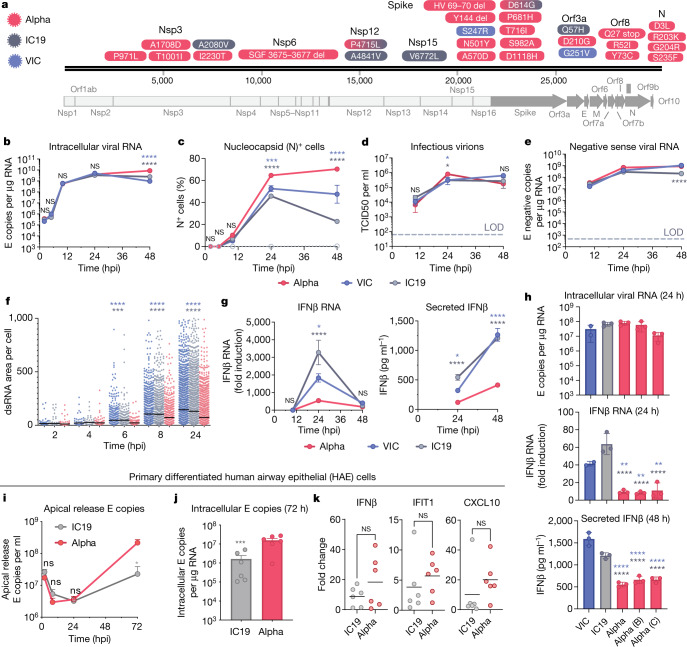
Fig. 1. The SARS-CoV-2 Alpha variant antagonizes innate immune activation more efficiently than early-lineage isolates.
a, Protein-coding changes in SARS-CoV2 Alpha (red), early-lineage IC19 (grey) and early-lineage VIC (blue) are indicated in comparison to the Wuhan-Hu-1 reference genome (MN908947). b–e, Viral replication after infection of Calu-3 cells with 5,000 E copies per cell. LOD, limit of detection. b, Intracellular viral RNA. c, Nucleocapsid (N)+ cells. d, Infectious virions (TCID50, 50% tissue culture infectious dose). e, Negative-sense viral RNA. f, Total area of dsRNA area per cell measured by single-cell immunofluorescence in Calu-3 cells infected with 2,000 E copies per cell. g, Expression and secretion of IFNβ by cells in b. h, Replication (intracellular viral RNA; 24 h) and IFNβ expression (24 h) and secretion (48 ) after infection of Calu-3 cells with 250 E copies per cell. i, j, Measurements of infection in primary differentiated HAE cells infected with 2,000 E copies per cell (j, 72 h). k, Expression of IFNβ and ISGs in cells from j. Mean ± s.e.m. of one of three representative experiments performed in triplicate. For i–k, n = 6, two independent donors. For f, one of two independent experiments with one data point per cell is shown. Two-way ANOVA (b–e) with Dunn’s multiple comparison test (f), one-way ANOVA with Tukey’s post-hoc test (g, h, i) or Wilcoxon matched-pairs signed rank test (j, k). Blue asterisks, Alpha versus VIC (blue lines and symbols); grey stars, Alpha versus IC19 (grey lines and symbols). *P < 0.05, **P < 0.01, ***P < 0.001, ****P < 0.0001; NS, not significant.

