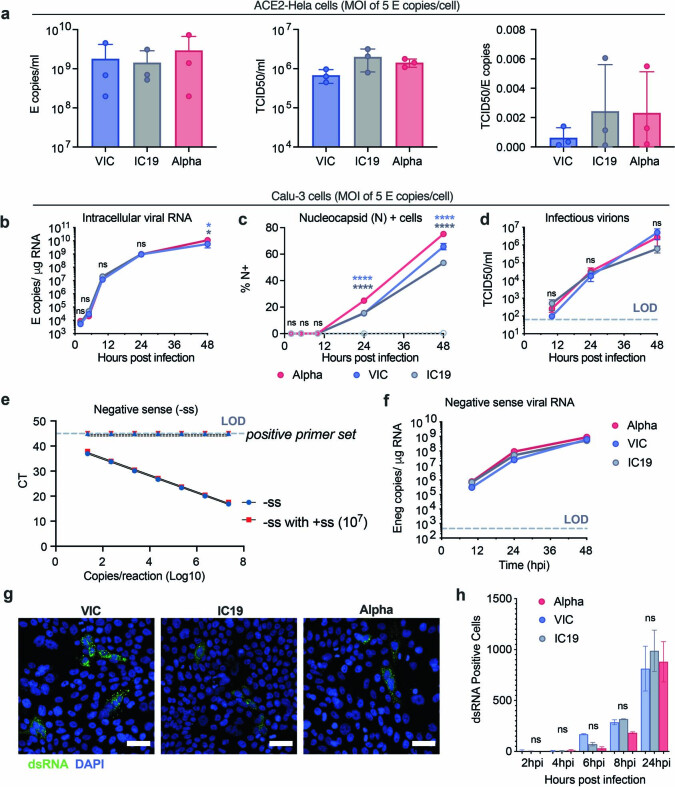
Extended Data Fig. 1. The SARS-CoV-2 Alpha variant replicates similarly to early-lineage isolates in Calu-3 cells.
a, E copies/ml (left), TCID50/ml (centre) and infectious units per genome (TCID50/E copies) (right) were measured in viral stocks. b–d, Calu-3 cell infection with 5 E copies/cell. Viral replication (b), % infection (c), and infectious virion production (d) are shown. e, Quantification of E gene negative sense standard RNA in the presence and absence of 107 positive sense E RNA copies. Positive sense E primer set run with negative sense standards, observed at the limit of detection. f. Negative sense E copies in cells from (b). g, h, dsRNA detection by single cell immunofluorescence in cells infected with 2,000 E copies/cell. Representative images at 24 hpi (g) and quantification of dsRNA-positive cells (h) are shown. Shown are mean ± s.e.m. of one of three representative experiments performed in triplicate. For (g) representative images from two independent experiments, quantified in (h), are shown. Scale bars are 50 μm. Two Way ANOVA (b,c,d,f) or One Way ANOVA with a Tukey post-hoc test were used. Blue stars indicate comparison between Alpha and VIC (blue lines and symbols), grey stars indicate comparison between Alpha and IC19 (grey lines and symbols). * (p < 0.05), ** (p < 0.01), *** (p < 0.001), **** (p < 0.0001). ns: non-significant. E: viral envelope gene. LOD, limit of detection.

