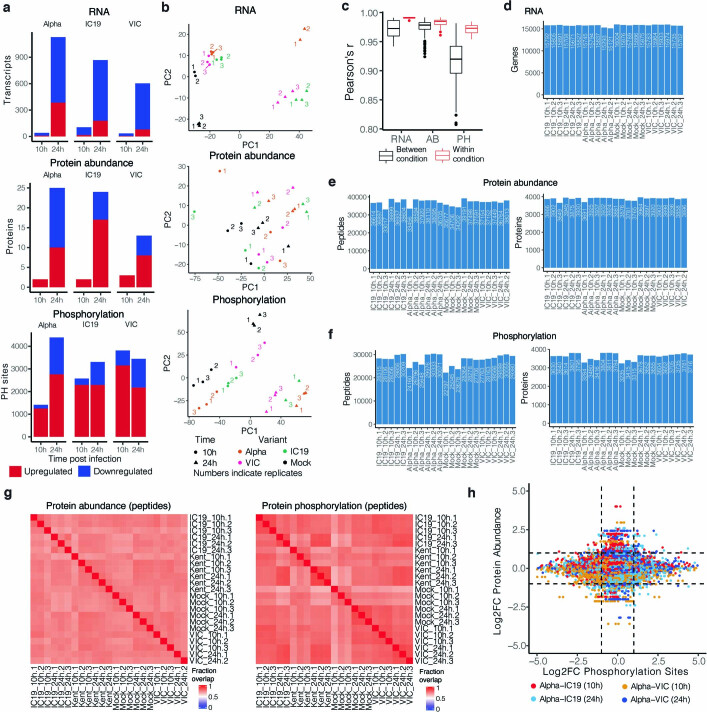
Extended Data Fig. 3. Omics data quality control and pathway enrichments.
a, Significantly changing genes for RNA, proteins for protein abundance, and phosphorylation sites for phosphoproteomics data. Significance was defined as abs(log2FC)>1 and adjusted p-value < 0.05. Red depicts positive log2 fold changes whereas blue depicts negative log2 fold changes. b, Principal components analysis (PCA) on normalized RNA transcripts per million (TPM), protein intensities, or phosphorylation site intensities. Non-finite values were removed and detections (transcripts, proteins, or phosphorylation sites) not shared (non-finite) between all conditions were discarded prior to analysis. Coloured numbers indicate biological replicates. c, Pairwise Pearson’s correlation between RNA, protein, or phosphorylation site abundance among replicates within the same condition (red) or between distinct conditions (black). d, Number of genes expressed above baseline in RNA-seq dataset per replicate. e, Number of peptides and proteins detected per replicate in the abundance proteomics dataset. f, Number of phosphorylated peptides and corresponding proteins from the phosphoproteomics dataset. g, Fraction of peptides from protein abundance (left) or phosphoproteomics (right; phosphorylated peptides) that overlap between two replicates. h, Correlation between Log2 fold-change (log2FC) phosphorylation sites and log2FC abundance of the corresponding protein. Dots are coloured according to the comparison between conditions.

