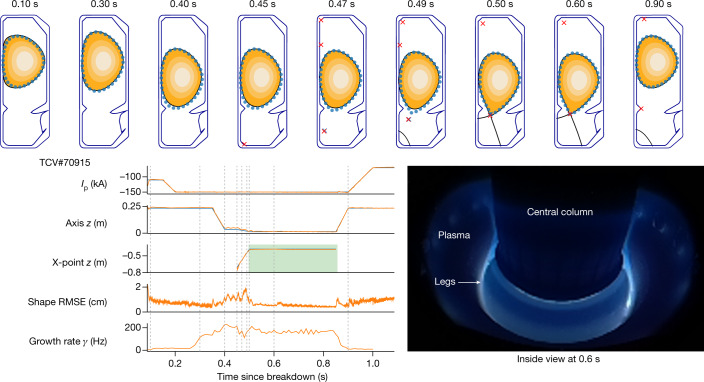
Fig. 2. Fundamental capability demonstration.
Demonstration of plasma current, vertical stability, position and shape control. Top, target shape points with 2 cm radius (blue circles), compared with the post-experiment equilibrium reconstruction (black continuous line in contour plot). Bottom left, target time traces (blue traces) compared with reconstructed observation (orange traces), with the window of diverted plasma marked (green rectangle). Bottom right, picture inside the vessel at 0.6 s showing the diverted plasma with its legs.

