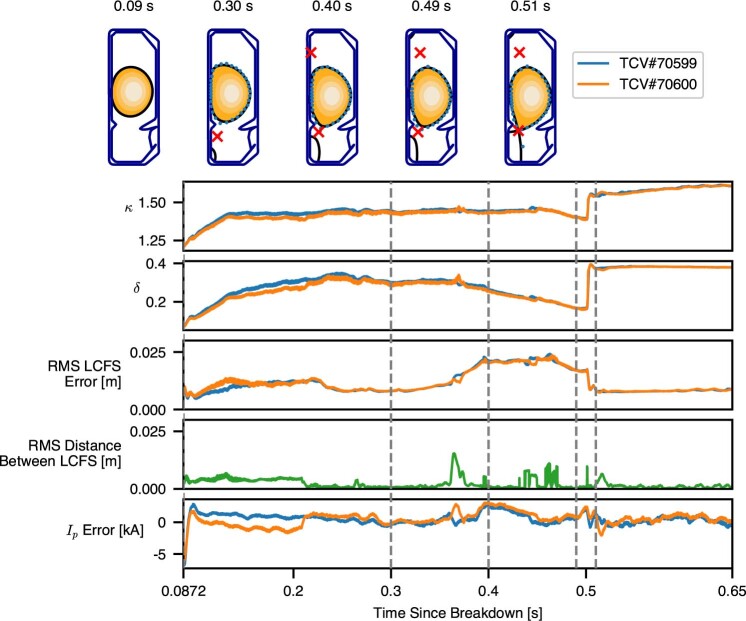
Extended Data Fig. 3. Control variability.
To illustrate the variability of the performance that our deterministic controller achieves on the environment, we have plotted the trajectories of one policy that was used twice on the plant: in shot 70599 (in blue) and shot 70600 (in orange). The dotted line shows where the cross sections of the vessel are illustrated. The trajectories are shown from the handover at 0.0872 s until 0.65 s after the breakdown, after which, on shot 70600, the neutral beam heating was turned on and the two shots diverge. The green line shows the RMSE distance between the LCFS in the two experiments, providing a direct measure of the shape similarity between the two shots. This illustrates the repeatability of experiments both in shape parameters such as elongation κ and triangularity δ and in the error achieved with respect to the targets in plasma current Ip and the shape of the last closed-flux surface.

