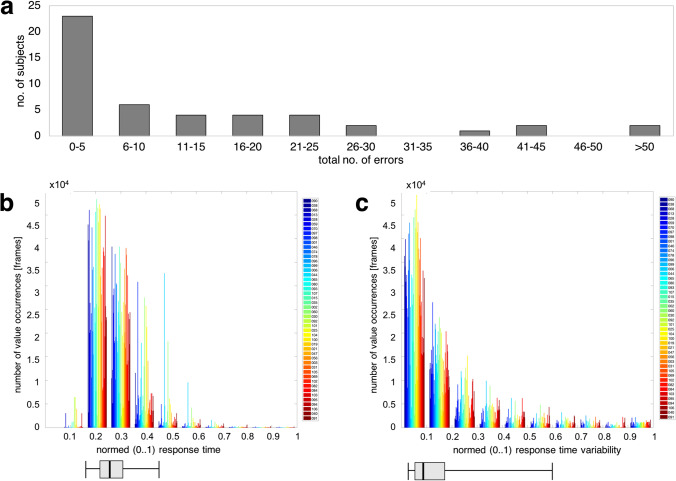
Fig. 2.
Frequency distributions of a false responses to catch trials (total number of errors per subject), b normalized (0..1) response time (RT) data (the subjects are shown in ascending order of the total number of errors. A box plot has been added, for which the following applies: box: 25th and 75th percentile, black line within the box: median, whisker: 5th and 95th percentile), c normalized (0..1) response time variability (RTV) data (the subjects are shown in ascending order of the total number of errors. A box plot has been added for which the following applies: box: 25th and 75th percentile, black line inside the box: median, whisker: 5th and 95th percentile)

