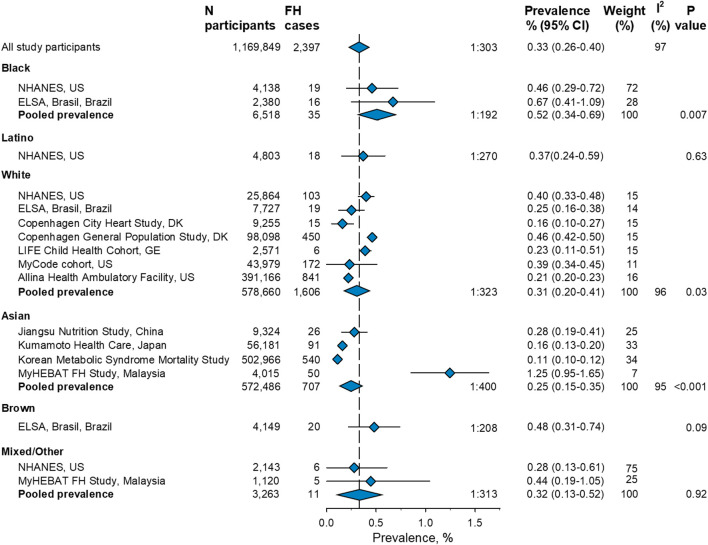
FIGURE 3.
Prevalence of familial hypercholesterolemia among ethnicities in 11 general population studies included in a meta-analysis. Small diamonds represent point estimates for individual studies. Large diamonds represent pooled meta-analysis estimates. Weight (%) is the weight of the study within each meta-analysis. Test for heterogeneity [I (Rader et al., 2003)] was significant for all meta-analyses (all p < 0.001). p-value is for comparison of the estimates for each ethnicity compared to the overall estimate (represented by the vertical broken line) of all participants. For information on ethnicity, refer to Methods. N, number, FH, familial hypercholesterolemia, CI, confidence interval.

