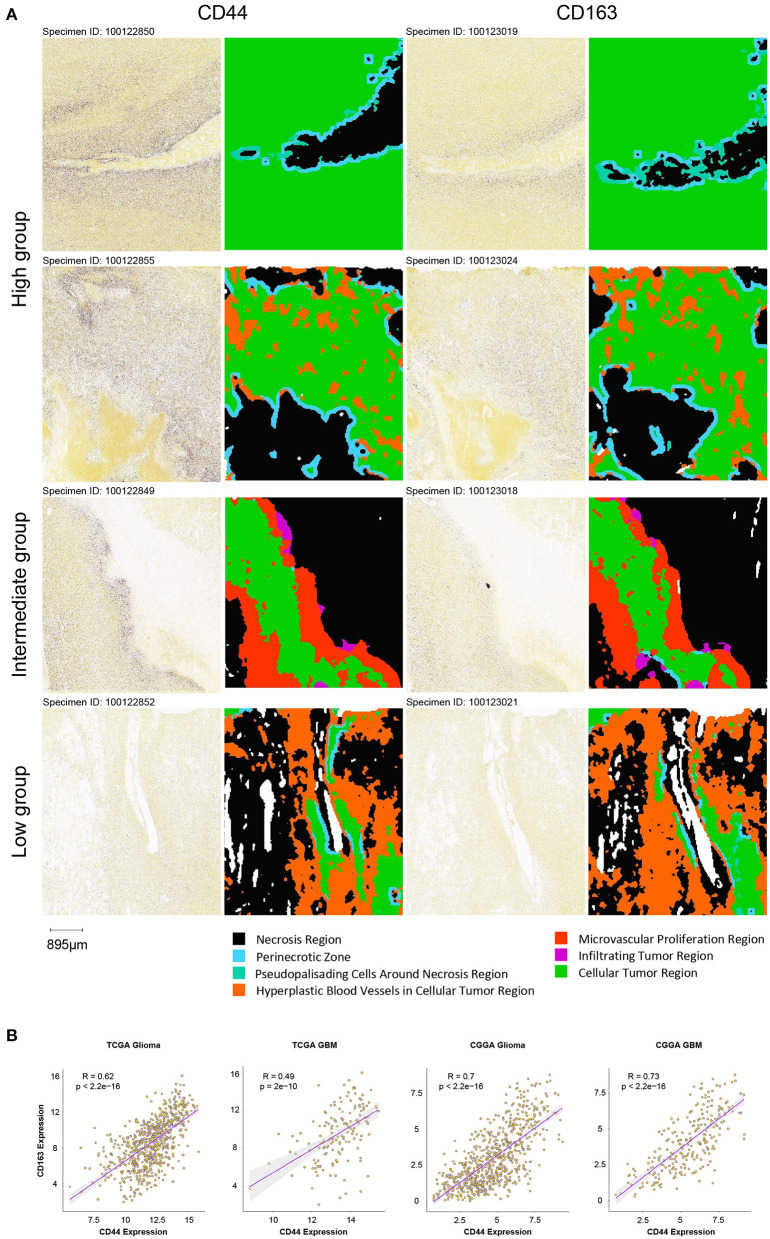
Figure 10.
Verification of infiltrating M2 TAMs in different groups. (A) Comparison of the infiltration of M2 TAMs (CD163+) among the high, intermediate and low intratumoral CD44+ cell groups in the IGAP IHC database. Scale, 895 μm. (B) Correlation of CD44 with CD163 in the TCGA and CGGA glioma datasets.

