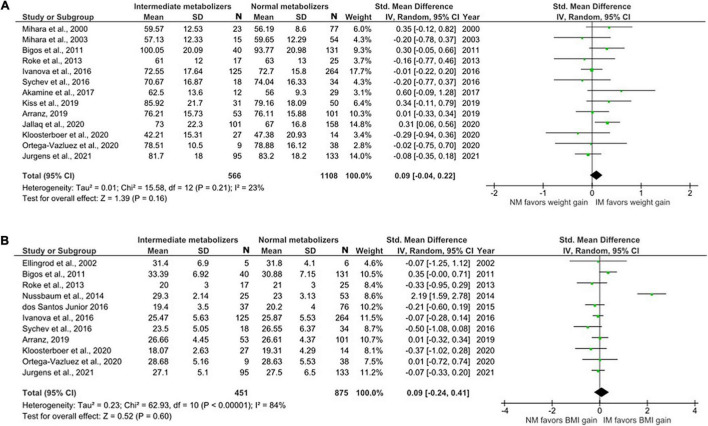
FIGURE 3.
Forest plots comparing (A) standardized mean weight differences (B) standardized mean BMI differences between Intermediate metabolizers and Normal metabolizers. Random effects model and inverse variance method were use. CI, confidence interval; df, degree of freedom; N, number of participants; SD, standard deviation; SMD, standardized mean difference.

