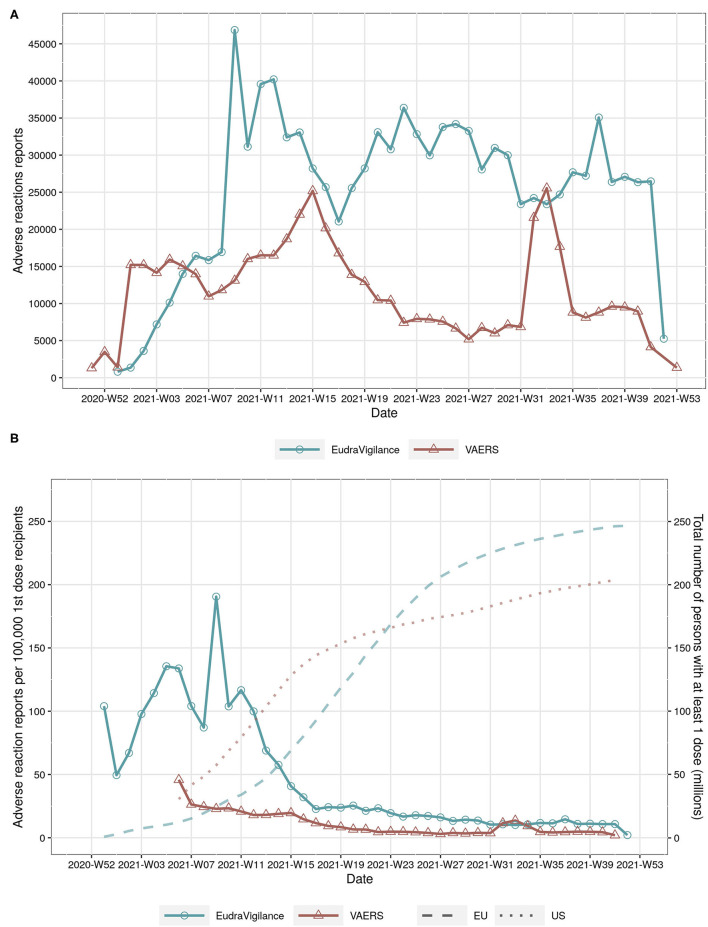
Figure 1.
(A) total number of adverse reactions reports in EudraVigilance and VAERS by year and week. (B) number of adverse reactions reports per 100,000 persons with at least 1 COVID-19 vaccine dose (continuous line, left y-axis) and total number of persons with at least 1 dose in the EU and US by year and week (dotted lines on background, right y-axis).

