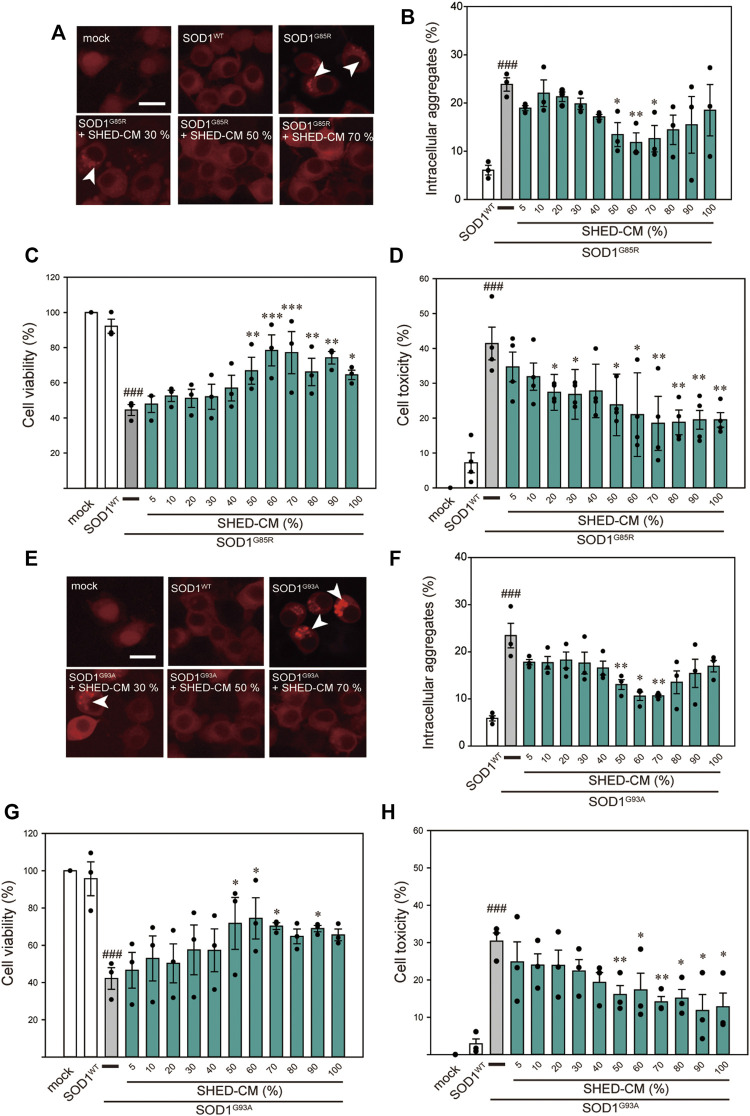
FIGURE 1.
SHED-CM protects against SOD1G85R- and SOD1G93A-induced aggregation and neurotoxicity. (A–E) shows data on the G85R variant, whereas (E–H) shows data on the G93A variant. (A and E): Representative fluorescent microscopy images of N2a cells expressing mCherry-SOD1G85R and mCherry-SOD1G93A incubated for 24 h with SHED-CM (5%–100%). Arrow heads show SOD1 aggregates. (B and F): Quantified data on intracellular SOD1 aggregates (expressed as means ± SEM of three independent experiments). In each experiment, at least 2,000 cells were counted. (C and G): Cell viability was measured via a CCK-8 assay. (D and H): Cell toxicity was measured via an LDH assay. N2a cells were differentiated under culture medium (2-mM dbcAMP and 2% FBS) in the presence or absence of SHED-CM (5%–100%/24 h). Results are presented as means ± SEM of three independent experiments or as a percentage of “mock” (mock = 100%). ###p < 0.001 vs. WT; ***p < 0.001, **p < 0.01, and *p < 0.05 vs. G85R and G93A. Scale bar: 10 µm.

