FIGURE 2.
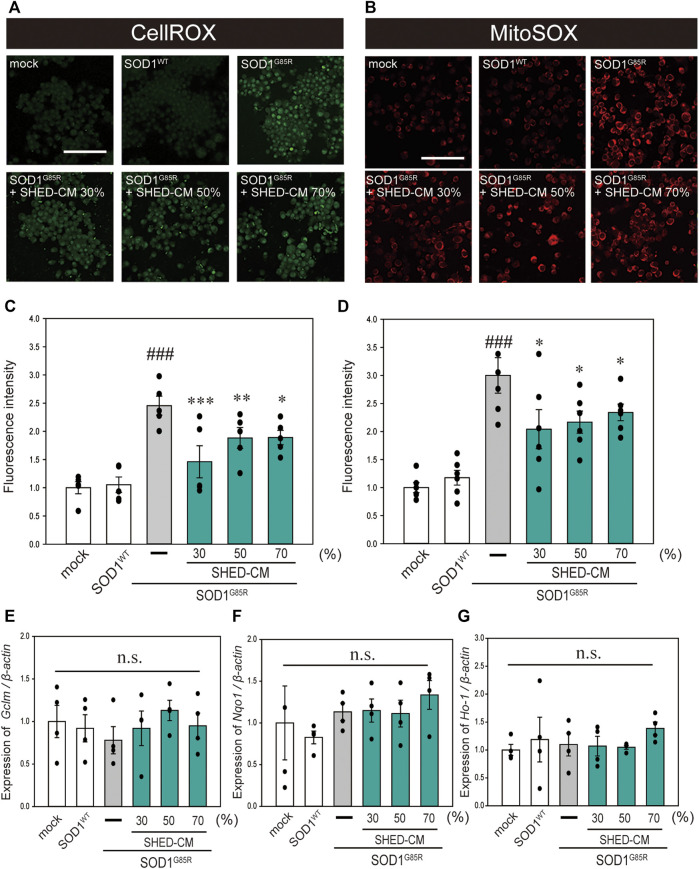
SHED-CM suppresses SOD1G85R-induced oxidative stress. (A): N2a cells expressing mCherry-SOD1G85R were treated with SHED-CM (30%, 50%, and 70%) for 24 h. Subsequently, CellROX Green was added to the cell culture to a final concentration of 5 μM and incubated for 30 min at 37°C. (B): MitoSOX Red was added to the cell culture to a final concentration of 5 μM and incubated for 30 min at 37°C. (C and D): The relative fluorescence intensities of CellROX and MitoSOX were respectively quantified by computerized image analysis with Image J. Results are presented as the means ± SEM of three independent experiments, based on the fluorescence intensity of the “mock” (mock = 1). ###p < 0.001 vs. WT; ***p < 0.001, **p < 0.01, and *p < 0.05 vs. G85R. Scale bar: 100 µm. (E–G): Expression of Gclm, Nqo1, and Ho-1 are presented as a ratio of β-actin, respectively. N2a cells expressing mCherry-SOD1G85R were treated with SHED-CM (30%, 50%, and 70%) for 24 h, and mRNA expressions were analyzed using a SYBR Green-based RT-qPCR assay. The expression levels of mRNAs were normalized to the expression level of β-actin mRNA. Results are presented as means ± SEM from three independent experiments based on the fluorescence intensity of the “mock” (mock = 1). n.s.: not significant.

