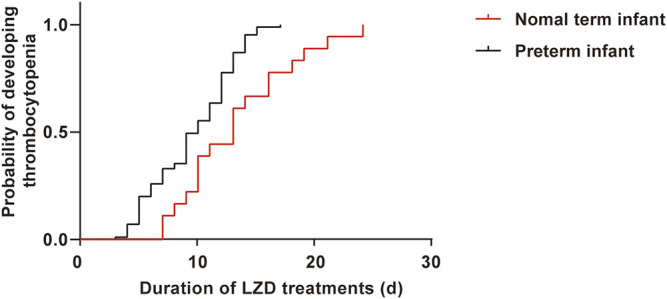
FIGURE 2.

The Kaplan–Meier plot showing the time from initiation of LZD therapy to development of thrombocytopenia in preterm infants and term infants. The time was much shorter in preterm, had significant differences when compared with term infants [10 (6, 12) vs. 13 (9.75, 16.5), p = 0.004].
