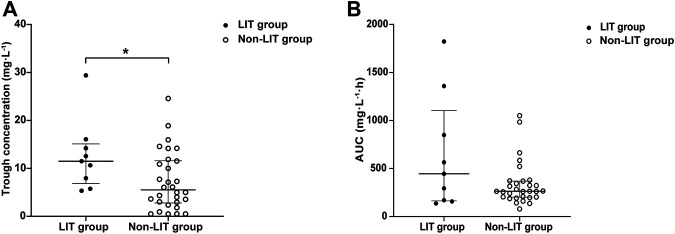
FIGURE 6.
(A) Distribution of LZD initial trough concentration in the LIT group and non-LIT group. Compared with the non-LIT group, trough concentration was significantly higher in the LIT group [11.49 (6.86, 15.13) vs. 5.51 (2.80, 11.61), *p = 0.027]. (B) Distribution of LZD AUC24h in the LIT group and non-LIT group.

