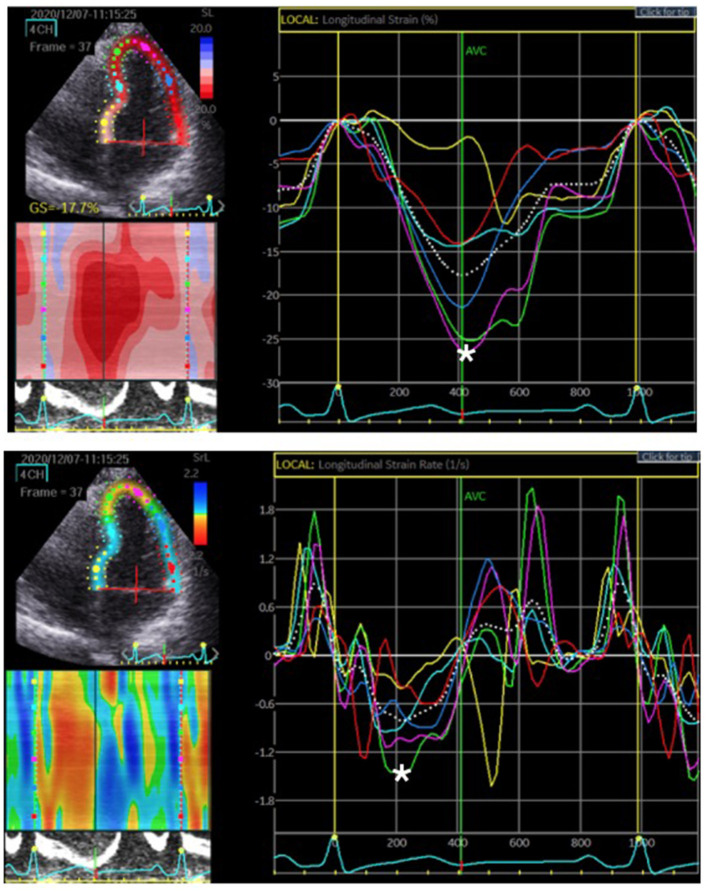
Figure 2.
The region of interest, LV myocardium, was tracked. The longitudinal strain and SR were quantified as the peak systolic value in each myocardial segment. The upper figure represents the peak systolic strain. The most negative value, which is denoted by the white asterisk, was measured before aortic valve closure (AVC). The lower figure represents the peak systolic SR. The most negative value is denoted by the white asterisk on the rate/time curve during systole.

