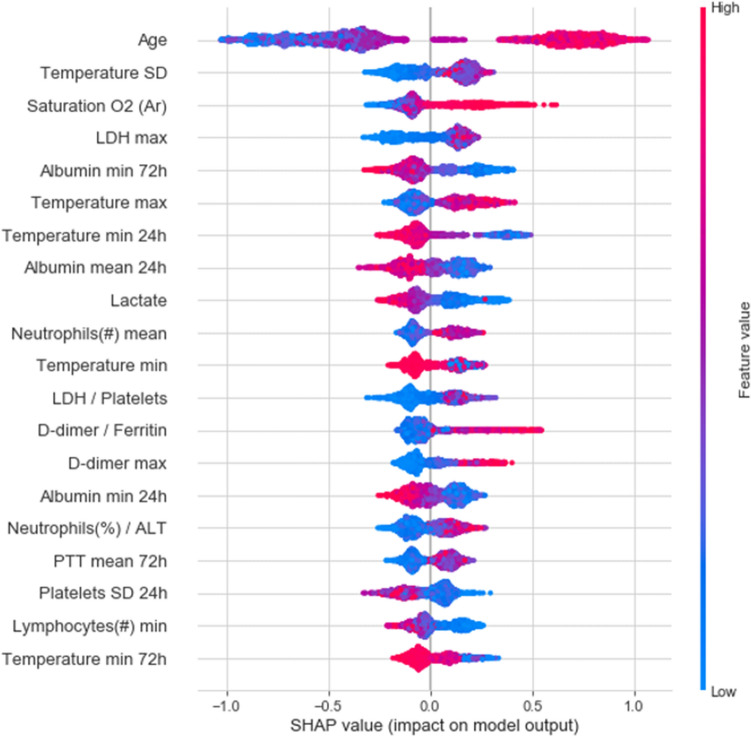
Figure 3.
20 features with highest mean absolute SHAP values. Features (rows) are ordered in decreasing overall importance to the prediction. The plot for each feature shows the SHAP value for each observation on the x-axis, with color representing the value of the feature from low (blue) to high (red). The absolute value indicates the extent of the contribution of the feature, while its sign indicates whether the contribution is positive or negative. SD: standard deviation; /: the ratio between two features. 24 h,72 h: time windows within the statistic was computed. If not mentioned, the statistics is calculated on the entire hospitalization period so far.

