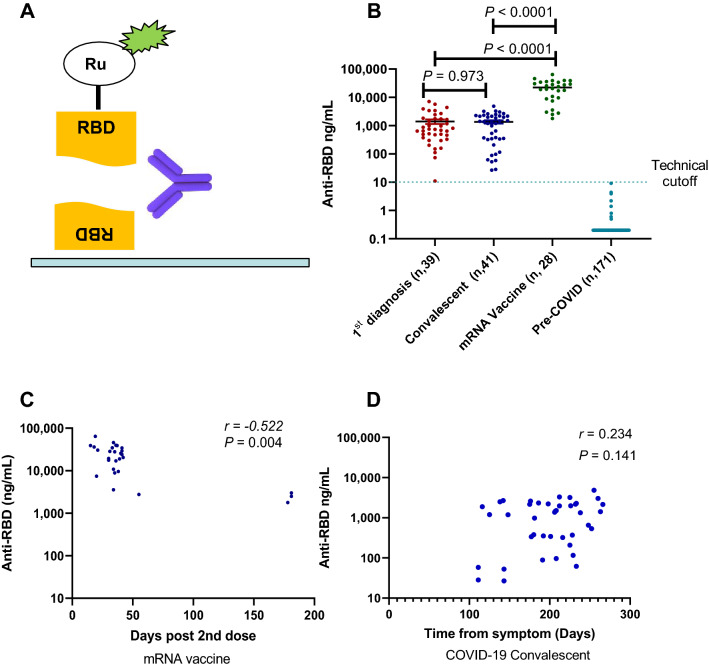
Figure 1.
COVID-19 serology assay and antibody levels. (A) Diagram of the serology assay using electrochemiluminescence detection method. The capture RBD protein was attached to the assay plate via biotin and the detection RBD was conjugated to the voltage-sensitive ruthenium (Ru) molecule to emit light. (B) Quantitative RBD antibody data from sera samples of three cohorts: (1) samples on the first seropositive test, (2) convalescent donors with documented COVID-19, (3) donors without prior COVID-19 and completed two doses of mRNA vaccines. Negative control samples were collected from healthy donors prior to Jan. 2020. (C) The RBD antibody levels and time association in vaccinated donors (r = − 0.522, P = 0.0044). (D) Lack of RBD antibody levels and time association in COVID-19 convalescent donors (r = 0.234, P = 0.141).

