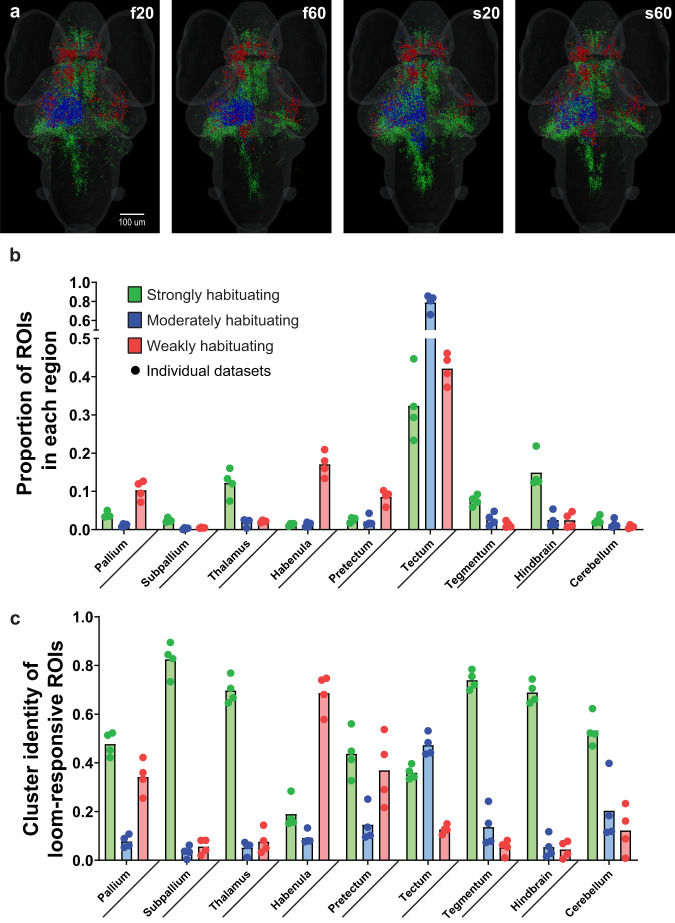
Fig. 3. Brain-wide responses during different loom stimulus trains.
a Brain-wide distributions of the functional clusters from Fig. 2 for each of four loom habituation paradigms. b Averaged proportions of ROIs in the four data sets, from the brain’s total number of each functional cluster, located in the indicated brain regions. c Averaged proportion of each cluster’s representation among the loom-responsive ROIs in each brain region. The individual paradigms (f20, f60, s20, and s60) are represented as circles, n = 4 paradigms. Statistical analysis of these proportions is detailed in Supplementary Tables 1 and 2.

