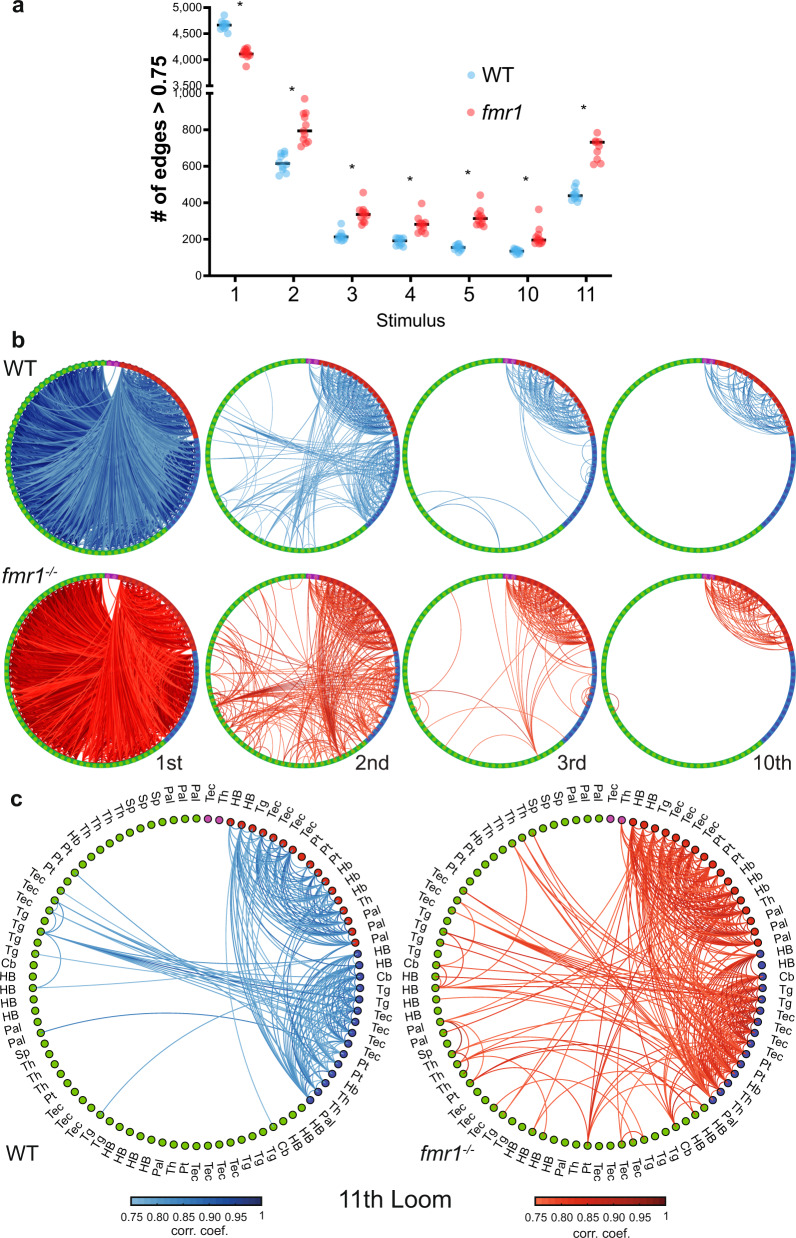
Fig. 6. Graph structure of WT and fmr1−/− habituation networks.
a Comparison of the average number of edges >0.75 at different loom presentations using the leave-one-out approach to generate group-averaged matrices for WT (n = 10) and fmr1−/− (n = 11). WT presents more edges at the 1st loom and fmr1−/− fish at the following loom presentations, including the first loom after recovery (the 11th). Repeated measures two-way ANOVA (one-sided) with the Geisser–Greenhouse correction followed by a Šidák’s multiple comparisons test. WT vs fmr1 > 0.75 edges Predicted mean diff., p values of multiple comparisons test (and Šidák’s correction adjusted p values): 1st Loom = 546.9, p ≤ 0.0001 (p ≤ 0.0001); 2nd Loom = −192.3, p ≤ 0.0001 (p ≤ 0.0001); 3rd Loom = −121.7, p ≤ 0.0001 (p ≤ 0.0001); 4th Loom = −94.98, p ≤ 0.0001 (p = 0.0001); 5th Loom = −165.6, p ≤ 0.0001 (p ≤ 0.0001); 10th Loom = −81.07, p = 0.0006 (p = 0.0039); 11th Loom = −311.1, p ≤ <0.0001 (p ≤ 0.0002). Black horizontal bars indicate the median. b, c Functionally sorted brain-wide graphs for WT and fmr1−/− larvae. Edges with correlations above 0.75 are shown between all combinations of nodes, and nodes are arranged by their functional clusters (Green: Strongly habituating; Blue: Moderately habituating; Red: Weakly habituating; Magenta: Inhibited). Graphs are shown for trials 1, 2, 3, and 10 (b), and trial 11 (c). The brain region to which each node belongs is indicated in (c), and is consistent across (b) and (c). Pallium, Pal; subpallium, Sp; thalamus, Th; habenula, Hb; pretectum, Pt; tectum, Tec; tegmentum, Tg; cerebellum, Cb; and hindbrain, HB.

