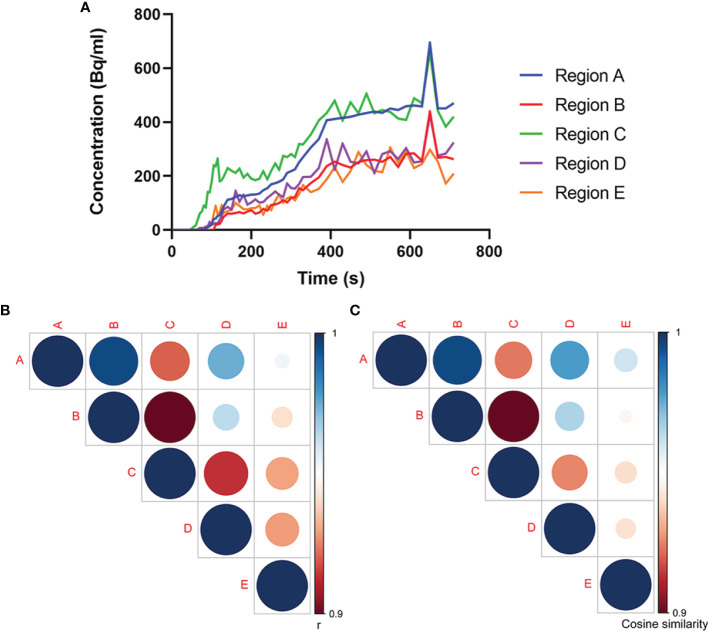
Figure 3.
Association analysis of 18F-FDG uptake in multiple regions. (A) Time–activity curves of 18F-FDG uptake at different sites. Analyses of (B) Pearson’s correlation coefficient and (C) cosine similarity index for time–activity curves between every two regions. The association between Regions A and B experiences highest Pearson’s correlation coefficient and cosine similarity index among the associations between every two regions, which confirms our speculation that Region B is the possible primary tumor site for Region A.

