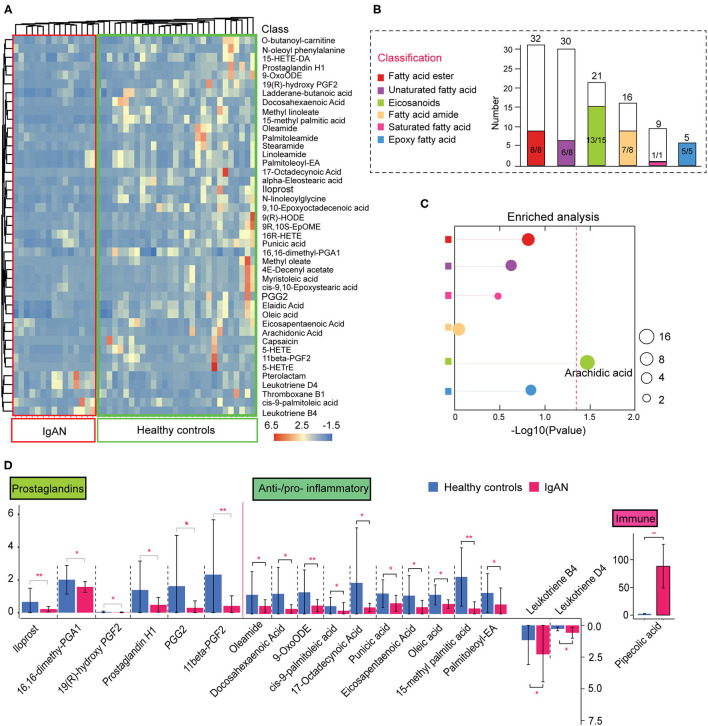
Figure 2.
Alterations in intestinal lipid metabolism in IgAN. (A) Heatmap of the significantly changed lipid metabolites in the feces samples. (B) Histogram of the overall variation trends in different lipid classifications. The height of the bar chart (white) indicates the number of all metabolites identified by LC-MS/MS in that classification. The colored bar part of the graph represents the number of the significantly altered metabolites under this classification. The denominator indicates the total number of the changed metabolites under this classification and the numerator indicates the number of significantly downregulated metabolites. (C) Enrichment analysis of significantly altered metabolites classes in fecal samples. The size of each spot indicates the number of metabolites that underwent significant changes in the corresponding metabolites class. Differently colored circles represent different lipid classifications. The dashed red line indicates the significant level (P < 0.05). (D) Functional classification of lipid metabolites and comparative analysis of the differences among the groups. *P < 0.05. **P < 0.01.

