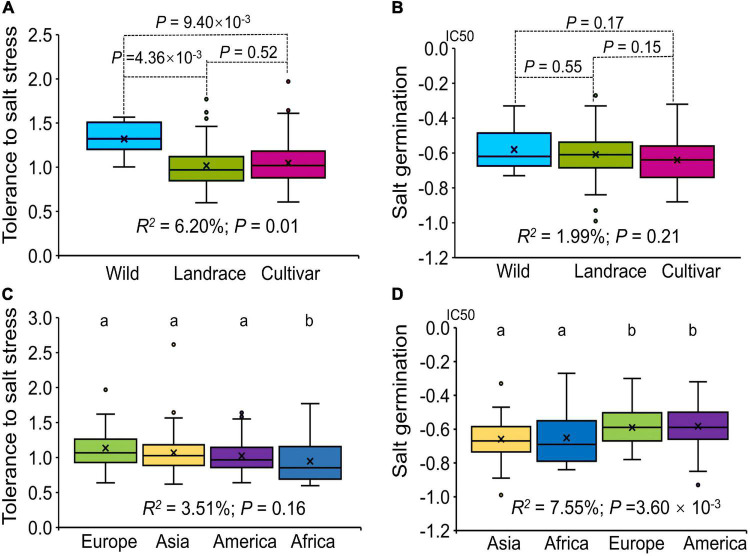
FIGURE 1.
Box plot showing the variation in tolerance to salt stress and germination ability under salt stress evaluated for the association panel. (A) Box plot of the tolerance to salt stress among subgroups (Wild, Landrace, Cultivar) according to breeding status. (B) Box plot of germination ability under salt stress among subgroups (Wild, Landrace, Cultivar). (C) Box plot of the tolerance to salt stress among subgroups (Europe, Asia, America and Africa) according to geographical origin. (D) Box plot of germination ability under salt stress among subgroups (Europe, Asia, America and Africa). The different letters above the boxplots in (C,D) indicate significant differences at the P < 0.05 level according to Duncan’s multiple comparisons test.

