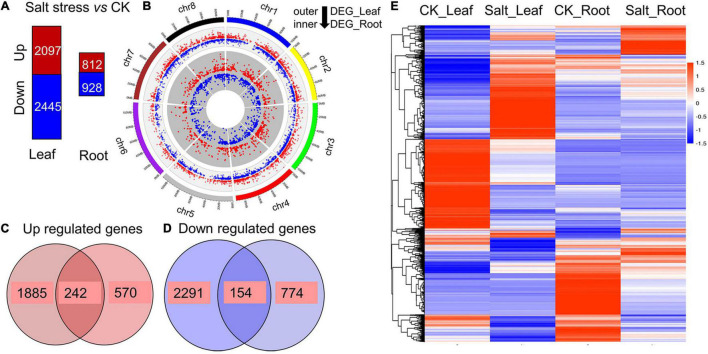
FIGURE 3.
Transcriptome analysis. (A) Number of upregulated genes (red) and downregulated genes (blue) between alfalfa seedlings under salt stress and those under normal conditions. (B) Distribution of DEGs in the leaves and roots of alfalfa. The inner circle indicates the DEGs in the roots, and the outer circle indicates the DEGs in the leaves. (C) Upregulated DEGs common to the leaves and roots. (D) Downregulated DEGs common to the leaves and roots. (E) Heatmap clustering of all the DEGs according to their expression abundance. The different colors indicate different levels of expression abundance.

