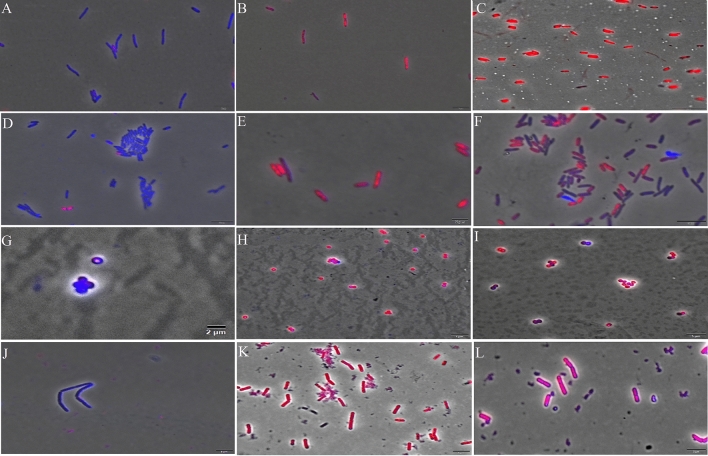
Figure 6.
Fluorescence microscopy in cells stained with DAPI and PI after 15 min of exposure to ZnO NPs. Cells with intact membranes are artificially stained in blue, while cells with damaged membranes are stained in red. (A) E. coli (ATCC 8739) cells in nutrient broth medium (negative control); (B) E. coli (ATCC 8739) cells treated with heat-shock stress (positive control); (C) E. coli (ATCC 8739) cells treated with ZnO NPs at IC100; (D) P. aeruginosa (ATCC 27853) cells in nutrient broth medium (negative control); (E) P. aeruginosa (ATCC 27853) cells treated with heat-shock stress (positive control); (F) P. aeruginosa (ATCC 27853) cells treated with ZnO at IC100; (G) S. aureus (ATCC 6538) cells in nutrient broth medium (negative control); (H) S. aureus (ATCC 6538) cells treated with nisin at 5 µg mL−1 (positive control) (I) S. aureus (ATCC 6538) cells treated with ZnO at IC100; (J) B. subtilis (ATCC 19659) cells in nutrient broth medium (negative control); (K) B. subtilis (ATCC 19659) cells treated with nisin at 5 µg mL−1 (positive control); (L) B. subtilis (ATCC 19659) cells treated with ZnO at IC100. Scale bar 2 μm; × 100 magnification.

