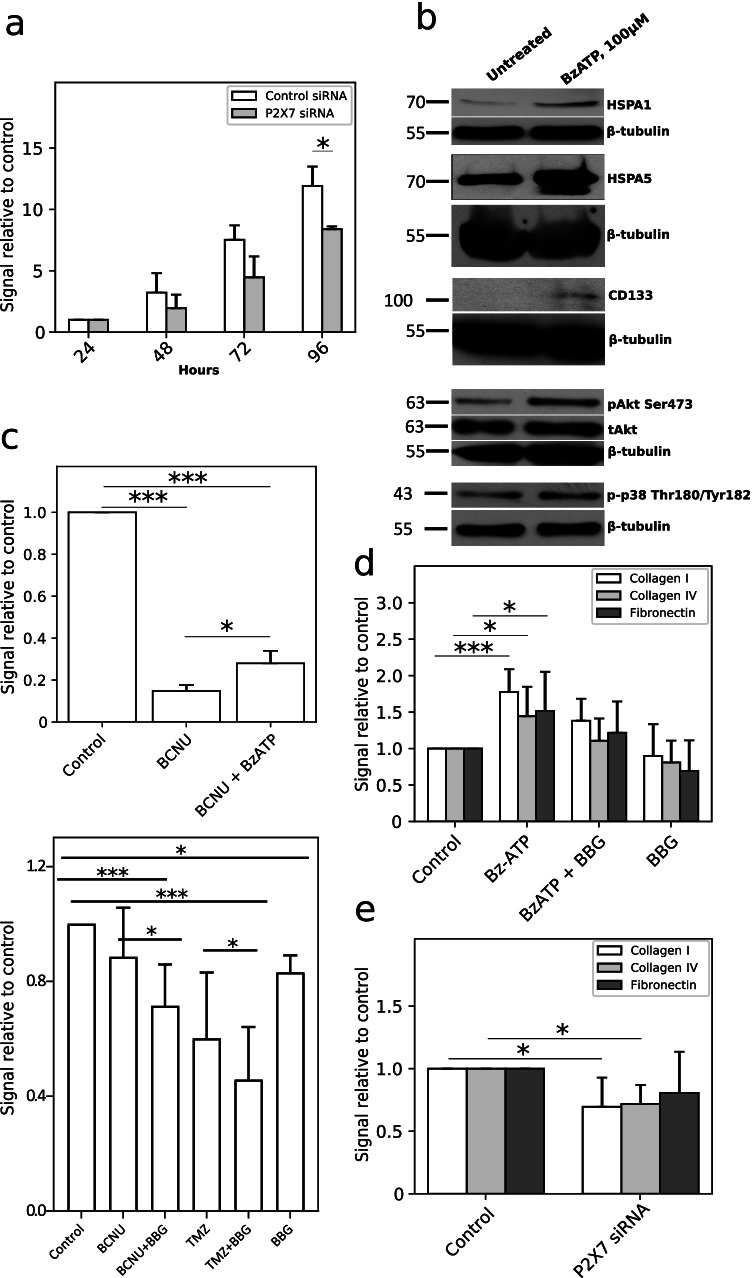
Fig. 2.
P2X7 activation increased C6 cell proliferation, viability, and cell adhesion in vitro. Quantitative data are presented as signal relative to control. a MTS test of long-term C6 cell viability after 100 µM BzATP stimulation of control cells and cells with P2X7 downregulation using RNAi (n = 3). The significance of the differences was determined with paired t-test: *P ≤ 0.05, **P ≤ 0.01, ***P ≤ 0.001 vs. the respective control. b Representative Western blot analysis of pro-survival and pro-proliferative proteins: p-p38 (Thr180/Tyr182), pAkt (Ser473), tAkt, CD133, HSPA1, and HSPA5 in C6 cell lysates after 24-h BzATP stimulation (n = 3). c Upper panel: MTS test of C6 cell viability after 200 µM BCNU (carmustine) treatment for 24 h. Co-treatment with 100 µM BzATP and 200 µM BCNU increased viability of C6 cells (n = 3). The significance of the differences was determined with one-way ANOVA with Bonferroni post hoc test: *P ≤ 0.05, **P ≤ 0.01, ***P ≤ 0.001 vs. all groups. Bottom panel: a crystal violet assay demonstrating a synergistic effect of BBG with BCNU/TMZ co-treatment on C6 cell growth for 24 h (n = 6). The significance of the differences was determined with repeated measures one-way ANOVA with Duncan’s multiple range post hoc test: *P ≤ 0.05, **P ≤ 0.01, ***P ≤ 0.001 vs. all groups. d P2X7 activation affects C6 cell adhesion to extracellular matrix components: collagen I, collagen IV, fibronectin. C6 cells showed higher adhesion potential after 24-h BzATP stimulation. 24-h co-treatment/treatment with 100 nM BBG significantly decreased C6 cell adhesion to ECM components (n = 6). The significance of the differences was determined with one-way ANOVA with Bonferroni post hoc test: *P ≤ 0.05, **P ≤ 0.01, ***P ≤ 0.001 vs. control group. e P2X7 RNAi downregulation declined C6 cell adhesion to ECM components upon BzATP stimulation (n = 4). The significance of the differences was determined with paired t-test: *P ≤ 0.05, **P ≤ 0.01, ***P ≤ 0.001 vs. the respective control

