Fig. 3.
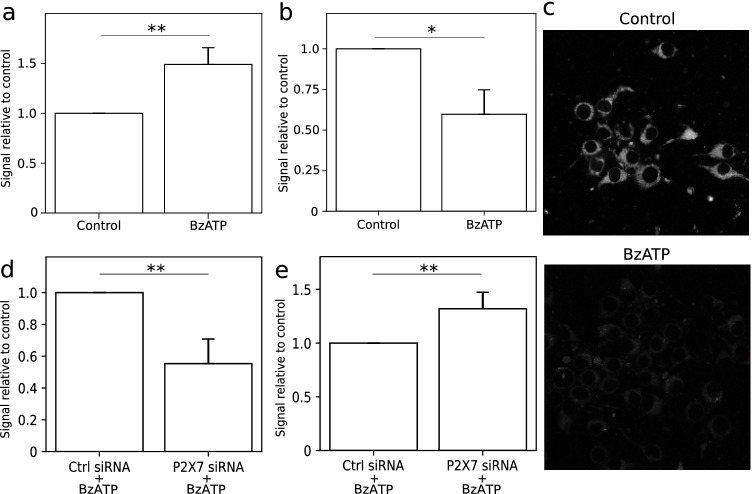
Activation of P2X7 receptor led to elevated ROS production and mitochondrial membrane depolarization in C6 cells. Quantitative data are presented as signal relative to control. a DCF-DA fluorescence measurement in C6 glioma cells. Cells stimulated with 100 µM BzATP for 1 h were characterized by increased ROS production compared to control in C6 cells (n = 3). The significance of the differences was determined with one-way ANOVA with Bonferroni post hoc test: *P ≤ 0.05, **P ≤ 0.01, ***P ≤ 0.001 vs. control group. b Potential-dependent staining of mitochondria in C6 cells using JC-1. 1-h BzATP (100 µM) stimulation led to considerable mitochondrial membrane depolarization (n = 3). The significance of the differences was determined with one-way ANOVA with Bonferroni post hoc test: *P ≤ 0.05, **P ≤ 0.01, ***P ≤ 0.001 vs. control group. c Representative images of MitoTracker Red CMXRos accumulation in C6 cells stimulated with 100 µM BzATP for 1 h. d DCF-DA fluorescence measurement in C6 glioma cells with RNA interference of P2X7 expression (n = 4). Downregulation of P2X7 led to decreased ROS production in C6 cells after 1-h BzATP (100 µM) stimulation. The significance of the differences was determined using paired t-test: *P ≤ 0.05, **P ≤ 0.01, ***P ≤ 0.001 vs. the respective control. e Potential-dependent staining of mitochondria using JC-1 dye in C6 cells with RNA interference of P2X7 expression after 1 h of 100 μM BzATP pre-treatment (n = 3). The amount of depolarized mitochondria was higher in control cells when compared to that in cells with P2X7 downregulation. The significance of the differences was determined using paired t-test: *P ≤ 0.05, **P ≤ 0.01, ***P ≤ 0.001 vs. the respective control

