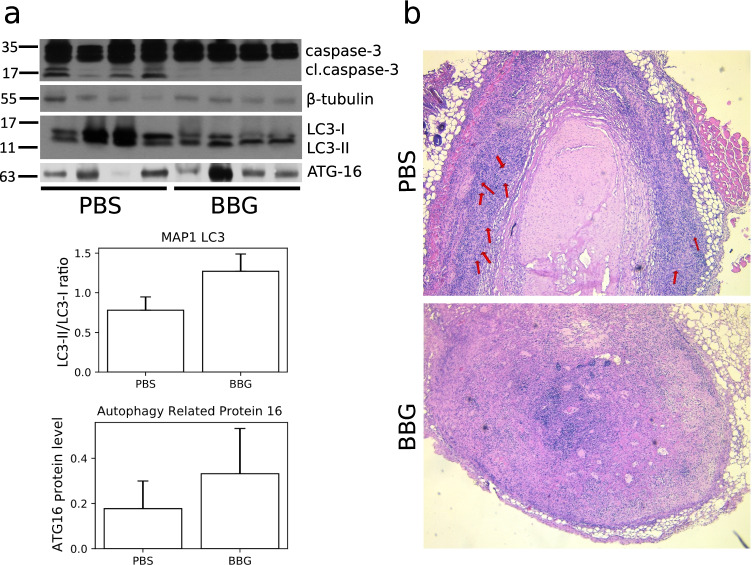
Fig. 5.
a Representative Western blot showing decline of caspase-3 cleavage and changes in the level of autophagy-related proteins in tumor homogenates after BBG treatment. The densitometric analysis plots of LC3 and ATG16 proteins placed below the Western blot image. b Representative image of hematoxylin and eosin staining of C6 glioma tumors. The images were acquired using × 20 objective. Arrows point to palisades and pseudopalisades in the tumor tissue

