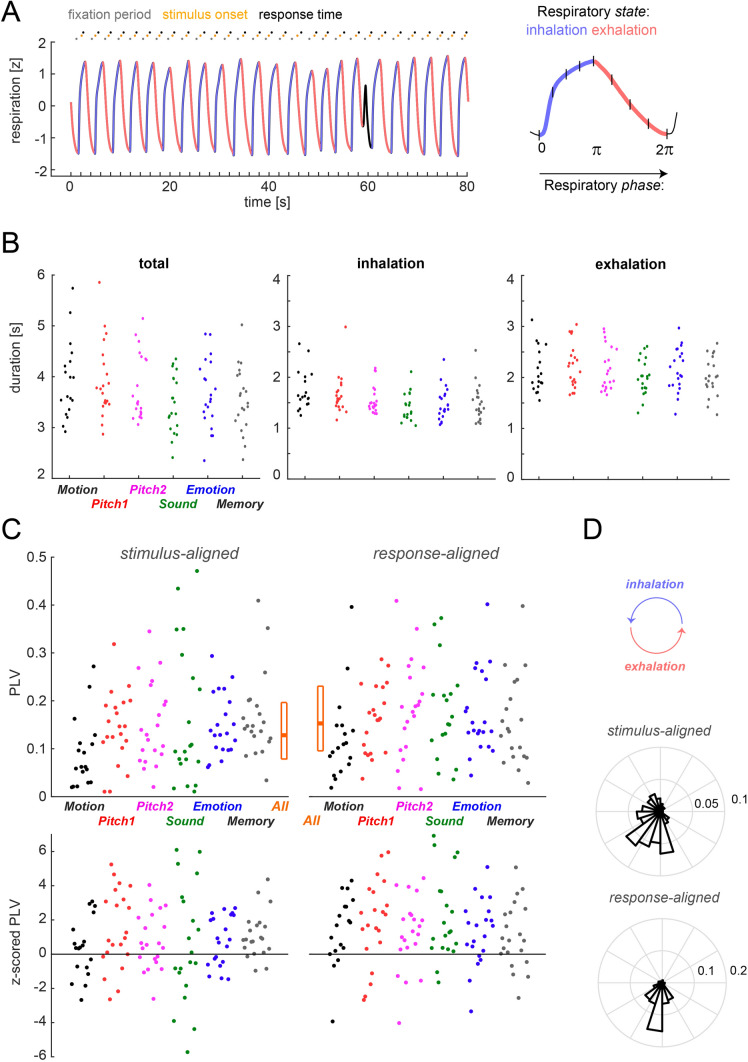
Figure 1.
Detection of respiratory cycles and their alignment to paradigm events. (A) Respiratory cycles were automatically segmented into inhalation (blue) and exhalation (red) periods, while atypical cycles were excluded (black). The trace shows one example signal (z-scored) together with the timing of trials for one participant in the Sound paradigm. The right panel shows how respiratory variables were coded as either a continuous cyclic variable (to test for an alignment of respiration to the paradigm); or using 4 phase-bins during inhalation and exhalation respectively (to test for a relation between respiration and performance). (B) Duration of respiratory cycles, and the inspiration and expiration states separately per paradigm (color-coded) and participant (dots indicate the participant-wise median values). (C) Alignment of respiratory cycles to paradigm events (stimulus onset, response times). The upper panels show participant-wise phase-locking values (PLV), the lower panel the same data but z-scored to participant-specific randomization distributions (based on 2000 randomizations). Here positive values indicate stronger phase-locking than expected by chance. (D) Distribution of participant-wise average phase values at stimulus onset or response times (derived as circular mean across trials).

