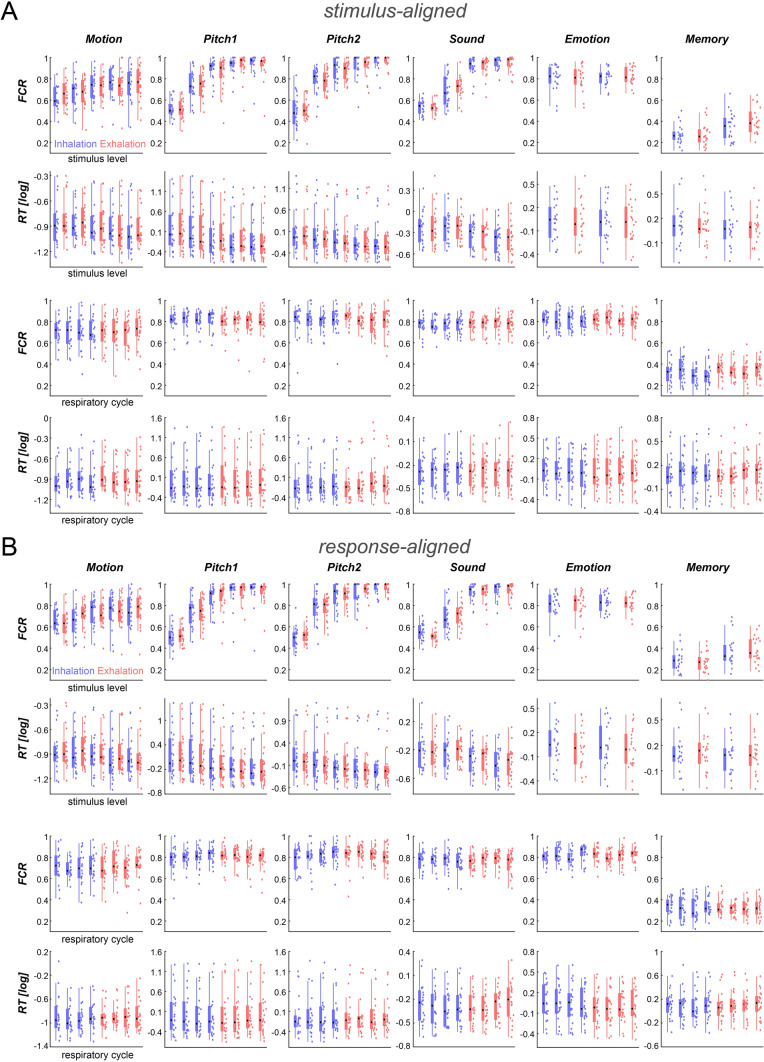
Figure 3.
Behavioural performance for individual paradigms and participants. For each paradigm the panels show the fraction of correct response (FCR) or log-transformed reaction times (RT). The upper two panels show these as a function of respiratory state (inhalation, exhalation; color-coded) and stimulus level; the lower two panels as a function of respiratory state and phase bin (averaged over levels). (A) Shows the data based on the respiratory variables at stimulus onset. (B) Shows the data based on the respiratory variables at response times. Boxplots indicate the central quartiles and median (black circle), individual coloured-dots the participant-wise data.

