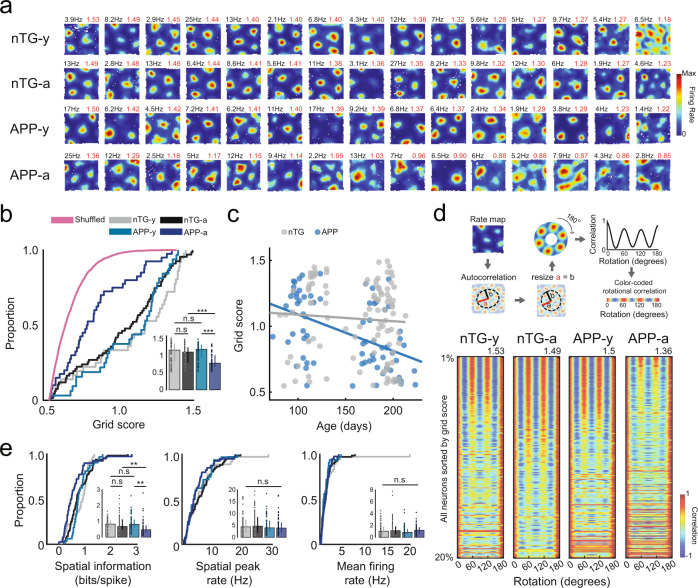
Fig. 1. Reduction of grid cell spatial periodicity in adult APP transgenic mice.
a Firing rate maps for grid cells from each experimental group. Each row includes 15 grid cells with the highest grid scores sorted in descending order. Spatial peak firing rate and grid score are indicated in the rate map’s top-left and top-right, respectively. b Grid scores (nTG-y-nTG-a: P = 0.12; nTG-y-APP-y: P = 0.73; APP-y-APP-a: P = 1 × 10⁻⁷; nTG-a-APP-a: P = 2.5 × 10⁻⁶) between groups (cells, n = 64 nTG-y; n = 99 nTG-a; n = 74 APP-y; n = 50 APP-a). c Scatter plot displays grid score by age (in days) recorded. A two-way ANOVA examined the effects of age and genotype on grid score. There was a significant interaction between age and genotype: F (1, 280) = 11.99, P = 6.2 × 10⁻⁴. d Color-coded rotational correlations are shown, sorted in descending order of grid score. Neurons within the top 20% of grid scores are shown. The max grid score in each group is displayed at the top of the respective plot. e Spatial information (nTG-y-nTG-a: P = 0.77; nTG-y-APP-y: P = 0.34; APP-y-APP-a: P = 6.5 × 10⁻⁶; nTG-a-APP-a: P = 1.2 × 10⁻³), spatial peak firing rate (nTG-y-nTG-a: P = 0.59; nTG-y-APP-y: P = 0.79; APP-y-APP-a: P = 0.77; nTG-a-APP-a: P = 0.27), and mean firing rate (nTG-y-nTG-a: P = 0.99; nTG-y-APP-y: P = 0.086; APP-y-APP-a: P = 0.13; nTG-a-APP-a: P = 0.79) between groups (cells, n = 64 nTG-y; n = 99 nTG-a; n = 74 APP-y; n = 50 APP-a). nTG-y non-transgenic young, nTG-a non-transgenic adult, APP-y APP young, APP-a APP adult. Wilcoxon rank-sum tests (two-sided) corrected for multiple comparisons using a Bonferroni-Holm correction were applied to analyze the data in panels b and e. Data in bar graphs are presented as median values ± 25th and 75th percentiles; **P < 0.01, ***P < 0.001; n.s not significant. Source data are provided as a Source Data file.

