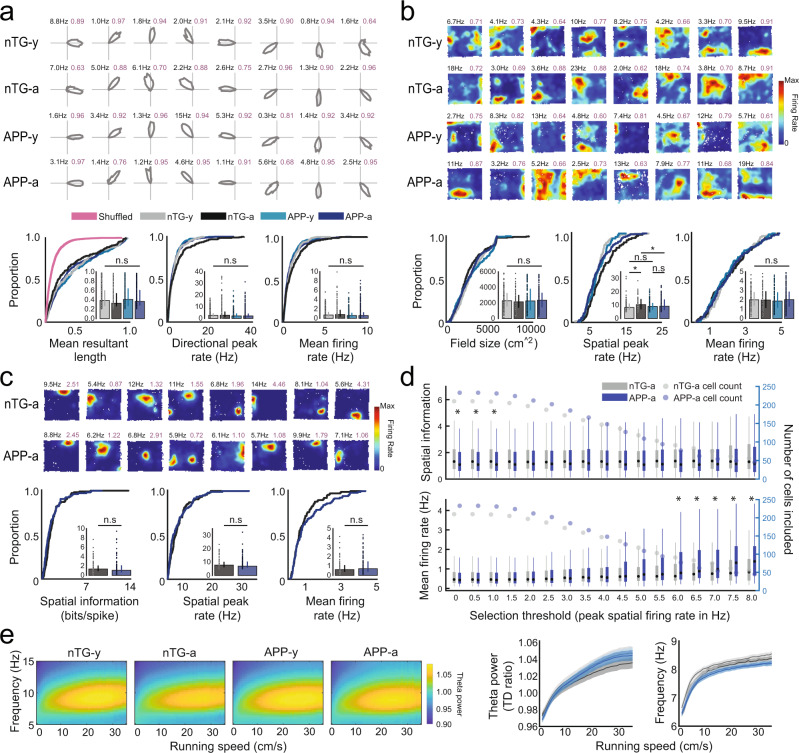
Fig. 2. Head-direction cells, non-grid spatially tuned cells, place cells, and MEC theta oscillations in APP mice.
a Head-direction polar plots; peak firing rate (F.R) (top-left), mean resultant length (MRL) (top-right). MRL (nTG-y-nTG-a: P = 0.051; nTG-y-APP-y: P = 0.45; APP-y-APP-a: P = 0.41; nTG-a-APP-a: P = 0.11), peak F.R (nTG-y-nTG-a: P = 0.44; nTG-y-APP-y: P = 0.21; APP-y-APP-a: P = 0.96; nTG-a-APP-a: P = 0.073), mean F.R (nTG-y-nTG-a: P = 0.18; nTG-y-APP-y: P = 0.28; APP-y-APP-a: P = 0.87; nTG-a-APP-a: P = 0.08). n = 295 nTG-y; 244 nTG-a; 305 APP-y; 471 APP-a. b Non-grid spatially tuned rate maps; peak F.R (top-left), split-half-reliability (top-right). Field size (nTG-y-nTG-a: P = 0.40; nTG-y-APP-y: P = 0.66; APP-y-APP-a: P = 0.64; nTG-a-APP-a: P = 0.37), peak F.R (nTG-y-nTG-a: P = 0.028; nTG-y-APP-y: P = 0.49; APP-y-APP-a: P = 0.73; nTG-a-APP-a: P = 0.032), mean F.R (nTG-y-nTG-a: P = 0.76; nTG-y-APP-y: P = 0.37; APP-y-APP-a: P = 0.50; nTG-a-APP-a: P = 0.93). n = 82 nTG-y; 83 nTG-a; 106 APP-y; 119 APP-a. c Place cell rate maps; peak F.R (top-left), spatial information (S.I) (top-right). S.I (P = 0.08), peak F.R (P = 0.32), mean F.R (P = 0.31). n = 118 nTG-a; 109 APP-a. d S.I (P left-to-right: 0.03; 0.03; 0.028; 0.057; 0.10; 0.15; 0.16; 0.28; 0.18; 0.12; 0.08; 0.16; 0.11; 0.12; 0.30; 0.31; 0.41), mean F.R (P left-to-right: 0.64; 0.64; 0.70; 0.81; 0.95; 0.99; 0.90; 0.82; 0.85; 0.73; 0.31; 0.24; 0.048; 0.016; 0.025; 0.027; 0.039) when varying peak F.R criterion. (nTG-a n left-to-right: 210; 210; 209; 205; 197; 187; 172; 159; 147; 136; 118; 103; 91; 83; 75; 61; 56. APP-a n left-to-right: 233; 233; 231; 224; 212; 202; 185; 166; 148; 127; 109; 94; 77; 62; 54; 49; 45) e MEC theta frequency and power versus running speed. Data are mean ± 99% confidence intervals. Wilcoxon rank-sum tests (two-sided) with Bonferroni-Holm’s correction were applied to panels a–d. Data in bar graphs are medians ± 25th and 75th percentiles; Boxplots present medians as dots, interquartile boxes from 25th to 75th percentile, whiskers from smallest to largest values; *P < 0.05; n.s not significant. Source data are provided as a Source Data file.

