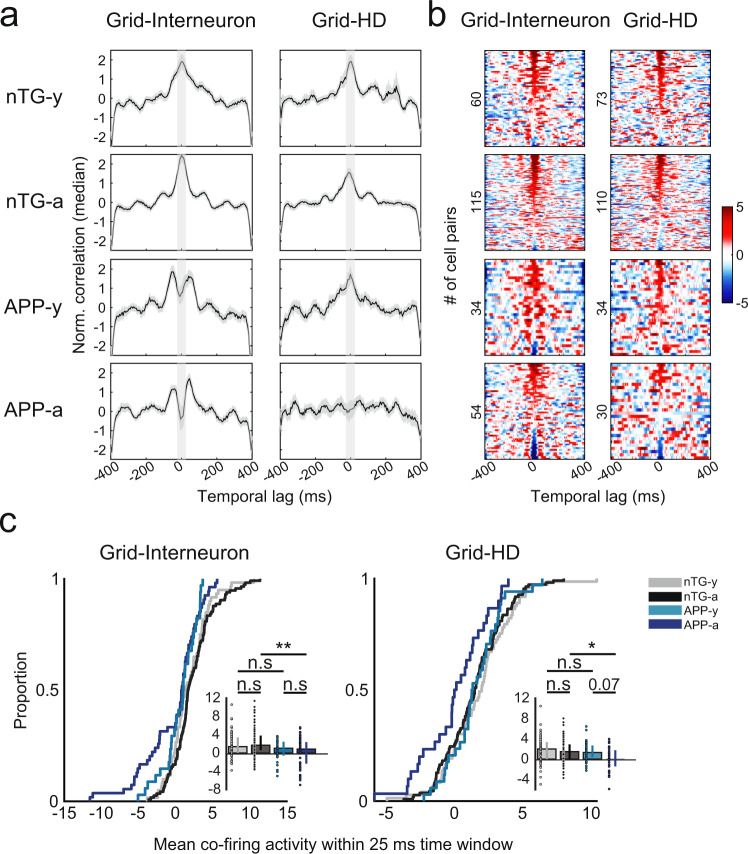
Fig. 4. Reduced spike-time synchrony in grid cell-interneuron and grid cell-head-direction cell pairs.
a Spike-time cross-correlations between grid cell-interneuron pairs (left) and grid cell-head-direction cell pairs (right) for all experimental groups (rows). Each panel displays the normalized correlation (by median) by time lag (in ms). Black curves indicate median values and gray contours indicate median absolute deviation. Lighter gray columns indicate the 25 ms time window in each lag direction from 0 ms. b Color-coded raster plots show the magnitude of co-activity within a 400 ms time window. Y-axes are sorted in descending order by cell pairs with the maximum co-activity within a 25 ms time window, and numbers indicate the number of cell pairs in each experimental group. c The mean co-activity within a 25 ms time window for grid-interneurons pairs (nTG-y-nTG-a: P = 0.30; nTG-y-APP-y: P = 0.13; APP-y-APP-a: P = 0.51; nTG-a-APP-a: P = 0.0018), and grid-head-direction pairs (nTG-y-nTG-a: P = 0.33; nTG-y-APP-y: P = 0.56; APP-y-APP-a: P = 0.078; nTG-a-APP-a: P = 0.038) between groups (grid-interneuron pairs, n = 60 nTG-y; n = 115 nTG-a; n = 34 APP-y; n = 54 APP-a; grid-head-direction pairs, n = 73 nTG-y; n = 110 nTG-a; n = 34 APP-y; n = 30 APP-a). nTG-y non-transgenic young, nTG-a non-transgenic adult, APP-y APP young, APP-a APP adult. Wilcoxon rank-sum tests (two-sided) corrected for multiple comparisons using a Bonferroni-Holm correction were applied to analyze the data in panel c. Data in bar graphs are presented as median values ± 25th and 75th percentiles; *P < 0.05, **P < 0.01; n.s not significant. Source data are provided as a Source Data file.

